
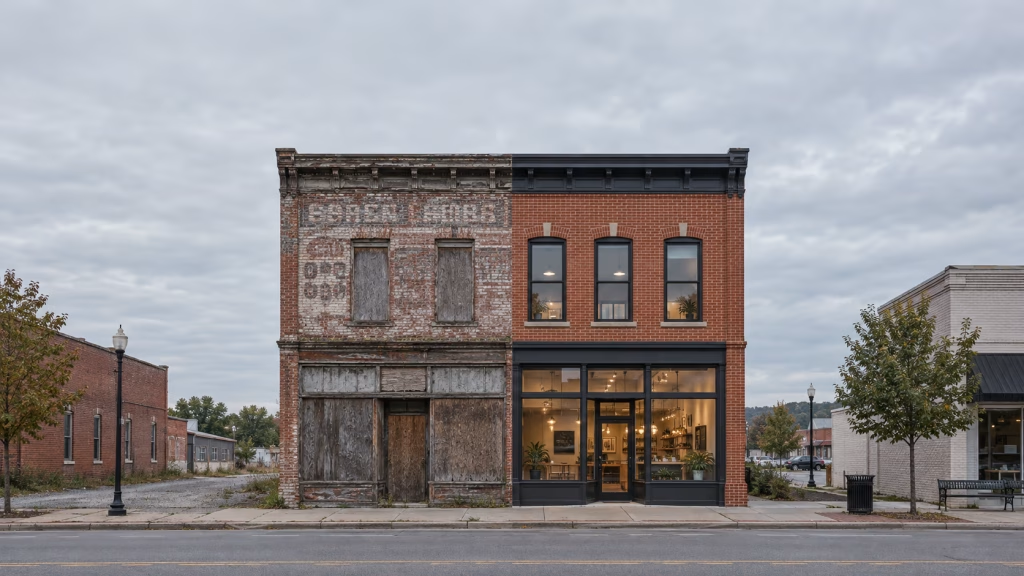
A renovated building on a struggling commercial corridor is easy to see. What is harder to see — and what matters more — is whether the incentive that helped pay for it actually changed the prospects of the people who live there.
That question is worth asking now, as the Opportunity Zones economic development program graduates to a second round over the next year, because the first round of the program now has a track record. It is a mixed record, and the honest version of it is more useful to a planner or an economic developer than either the sales pitch or the dismissal.
I will admit something up front. I worked in and with jurisdictions that held Opportunity Zones during the first round, and I did not really understand how the incentive operated until most of its benefits had run their course. That is a common experience, I believe.
The OZ program is complicated, the deadlines were unforgiving, and the patient equity it promised was easier to describe than to land. Let’s walk through the overview I wish I had read in 2018, when I was sitting in an office in an Opportunity Zone — and it draws on that state where it seems like they got the first round more right than most.

The Original Bargain
Congress created Opportunity Zones in the Tax Cuts and Jobs Act of 2017. The design was simple to state and easy to oversell. An investor who had realized a capital gain could roll that gain into a Qualified Opportunity Fund (QOF), which in turn invested in projects located in designated low-income census tracts. In exchange, the investor received three benefits: a deferral of tax on the original gain, a partial reduction of that gain through a basis step-up, and — if the investment was held for at least ten years — exclusion of tax on the new appreciation.
One point deserves emphasis, because it shapes what follows. This was a US Federal tax incentive for investors, not a grant to a city or county. Nothing flowed automatically to a community because a tract was designated. The incentive worked only if an investor with a capital gain could be matched to a viable project inside the zone. That matching problem turned out to be the whole ballgame — in central cities, in inner suburbs, and in small towns alike.
Governors nominated the tracts, subject to a cap of 25 percent of each state’s eligible low-income census tracts. The 2018 designations covered 8,764 tracts nationwide and remained in effect, under current law, through the end of 2028.
What did standout OZ 1.0 projects look like? Real estate served as the dominant deployment tool, accounting for about 2/3 of total investment dollars. The Erie Downtown & Waterfront Revitalization fund, for example, secured over $100 million in QOF capital for comprehensive urban core renewal in Erie, Pennsylvania, while Detroit affordable housing initiatives successfully converted vacant homes into stable, affordable rental housing in the Motor City.
Though more complex due to compliance hurdles, several QOFs have also invested into operating entities and sustainable infrastructure. For example, one fund turned an empty 5,000 square foot building into a food hall in Craig, Colorado, with a small business incubator, co-working space, conference center, and coffeehouse (EIG case study). That said, the food hall closed last winter, providing a sobering caution about the reality of small town cash-flow for urban investors.
What the Evidence Supports
It helps to separate three questions that often get run together. Did money reach designated places? Did designation produce activity that would not otherwise have happened? And did the people who already lived in those places end up better off? These are different outcomes, and the research answers them differently.
On the first question, the answer is clearly yes, at a scale few federal programs can match. A Treasury Department analysis of IRS filings found that Qualified Opportunity Funds held $112 billion in deployed qualified opportunity zone property through the end of 2024, with investment reaching 6,026 of the 7,826 census tracts nominated by governors in 2018 — about 77 percent of designated tracts (EIG). That is real capital in real places, and the Treasury report classifies roughly 77 percent of it as real estate.
On the second question, the evidence is more encouraging than critics expected but less dramatic than supporters hoped. An EIG working paper estimates that Opportunity Zones were responsible for a net increase of 313,000 housing units over the five years between Q3 2019 and Q3 2024, above and beyond what would have otherwise occurred (EIG). Wheeler’s study of building permits across 47 large cities found that designation made urban communities about 20 percent more likely to see development activity in any given month, with effects strongest where there was available land, elastic housing supply, and lower home values — and, notably, with home values rising while rents stayed in check through new supply (EIG research brief). Construction happened. Housing got built.
The third question — did existing residents benefit? — is where the research gets real.

What the Jobs Research Found
The most rigorous look at employment outcomes to date is a working paper by Freedman, Kouchekinia, and Neumark of NBER (NBER Working Paper 34589). Their findings deserve to be quoted carefully, because the plain-English version often gets mucked up in coverage.
The paper estimates that OZ designation increased workplace jobs inside zones by about 1.3 percent. But roughly 83 percent of those gains were offset by job losses in nearby low-income communities — meaning the program appears to have reallocated jobs geographically more than it created them net (NBER).
Who held the new jobs is even more pointed. Fewer than one of every eight newly created jobs in a typical OZ went to a resident of the same or another Opportunity Zone. More than 75 percent went to residents of comparatively affluent, non-low-income tracts (NBER). For a program whose stated purpose is revitalizing distressed communities, that finding cuts against the grain.
An earlier study using a different method — Freedman, Khanna, and Neumark’s analysis of ACS microdata through 2019 — found little to no evidence of positive effects on resident employment, earnings, or poverty (EIG research brief). The research brief cautions, fairly, that these are long-run outcomes and the study window was early. But the pattern across studies is consistent: buildings and permits respond quickly; resident outcomes respond slowly, if at all.
The research has an important limit worth naming. Because the original legislation did not require public disclosure of investment data, most of these studies estimate the effects of designation rather than of receiving investment. That distinction matters, and it is one reason the conclusions should be read as provisional rather than final.
The Urban-Rural Split
For me, a consequential finding in the jobs research is the urban-rural differential. The NBER paper states it plainly: “We find no evidence of positive impacts on LODES measures of jobs or on ACS measures of employment, earnings, or poverty in rural tracts. However, we find positive and statistically significant effects of OZ designation on resident and workplace job growth in urban areas” (NBER).
LODES is a US Census Bureau program, and Census loves their acronyms. The “L” is for Longitudinal Employer-Household Dynamics (LEHD). The ODES is of Origin-Destination Employment Statistics. The LOEDS data product measures spatial distributions of jobs, worker residence locations, and worker commute flows by census geographies. I am a big fan of their OnTheMap Tool to visualize in and out commuting patterns.
That is not proof that rural Opportunity Zones did no good. Employment and earnings are not the only outcomes that matter, and the study measures a specific set of labor-market indicators. But the researchers tested the obvious alternative explanations — that rural zones were simply poorer, or more geographically scattered — and the urban advantage persisted (NBER).
The honest translation for practice: in a smaller market, the question is not whether Opportunity Zones are good policy in the abstract. It is whether the incentive can connect a viable local project with patient equity in a market where projects are smaller, investor networks are thinner, and development capacity is limited. Round one did not often make that connection — which is precisely the problem the rural provisions of OZ 2.0 were designed to address.
Additionality and the Transparency Problem
Two further shortcomings show up across the research and practitioner accounts.
The first is what economists call additionality: would the project have happened anyway? It’s the “but-for” test for economic development incentives.
The Urban Institute’s early qualitative assessment, based on interviews with developers and fund managers, found mixed effects. Some reported that the incentives made a decisive difference; others were clear their project would have proceeded with or without OZ equity (Urban Institute). The most common assessment was that OZ financing was useful but not critical. Where the incentive did consistently help, observers agreed, was visibility — elevating neighborhoods and deals that investors might not otherwise have considered (Urban Institute).
The second shortcoming is structural: the original legislation did not require public disclosure of investment data, and tax information was treated as confidential. States and researchers were left to evaluate outcomes with one hand tied behind their backs. Illinois, in a candid white paper, reported that only about one-fifth of its eligible tracts had received OZ investment by the end of 2020 — the lowest of any state — and attributed its difficulty in assessing the program partly to the confidentiality of the underlying data. The reporting requirements Congress added in the 2025 law, which mandate annual Treasury reports on investment activity and periodic assessments of designated tracts against comparable areas, exist because this gap was real.

Colorado: The State That Got the Design Right
If the national picture is mixed, Colorado offers the most instructive counterpoint — and a case study in what state economic development practice can accomplish within a federal incentive’s limits.
Colorado’s OEDIT commissioned an impact-and-lessons-learned report on its program, and the findings, summarized in the agency’s FY 2022–2023 annual report, are striking (OEDIT annual report). The report found that Colorado ranked among the top states in the country for Opportunity Zone investment, and that OEDIT’s consistent engagement — technical support grants, education, webinars, and rounds of local recommendations — helped produce an unusually strong record of housing projects and business investments statewide.
The numbers back that up. State officials report $3.2 billion in private investment capital has flowed into Colorado’s 126 designated tracts since 2019, a figure still growing as the OZ 1.0 window closes in December (Colorado Sun). An independent analysis of the Treasury data scored Colorado’s OZ 1.0 hit rate — the share of designated tracts that actually received investment — at 96 percent, the highest in the country and well above the national average of 77 percent (OpportunityZones.com podcast).
What makes Colorado instructive, according to a HUD Best Practices report, is not just the outcome but the method. The state paired its zone designations with a deliberate support infrastructure :
- Technical support grants — small awards, under $10,000 each, administered by OEDIT to help communities do the groundwork
- A dedicated OEDIT staff position focused on organizing OZ strategy statewide
- Coordination with the Department of Local Affairs to offer modest grants to rural communities for economic modeling, prospectus development, and project technical assistance
- State-level complements — sales tax rebates, fast-tracked permitting, infrastructure subsidies, and utility discounts aimed at making OZ projects pencil
The federal Best Practices report from the President’s Opportunity Zone Council singled out communities including Pagosa Springs, Montrose, and Colorado Springs as early movers offering education, job training, marketing, and local incentives to drive growth in their zones (HUD Best Practices report). Notably, Colorado chose a map that leaned rural from the word go — a decision the EIG analysis credits as central to the state’s outsized hit rate (OpportunityZones.com podcast).
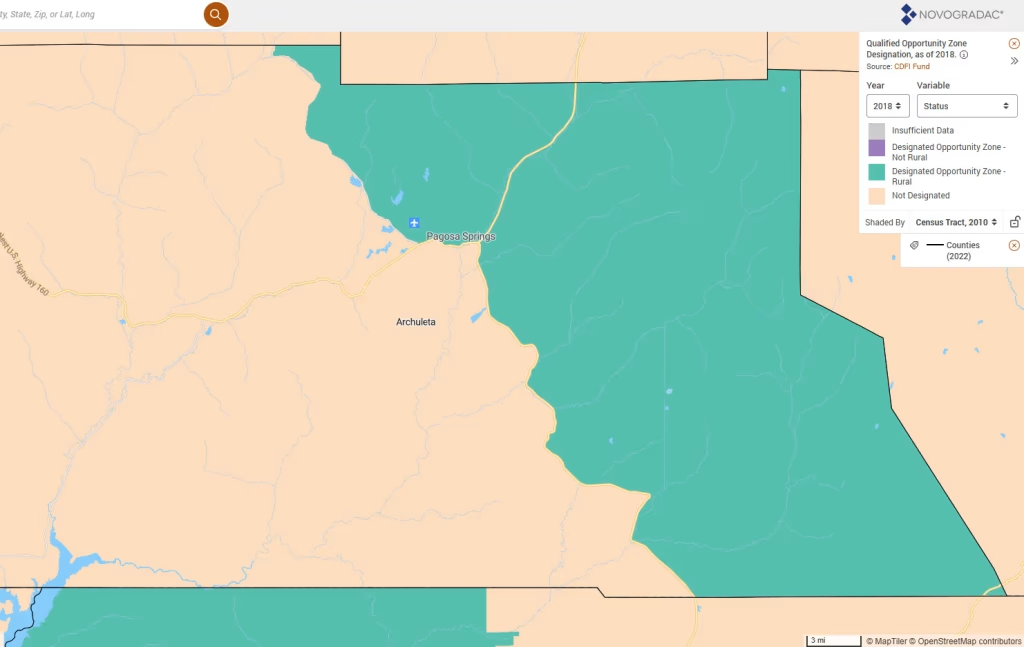
Here’s one observation, though, from my time inside an Opportunity Zone: One-third of Archuleta County east of Highway 84 was designated OZ 1.0. The other two-thirds west of the highway was not. Building boomed across Pagosa Springs on both sides of the highway starting about the time I moved there and continued strong through COVID, especially investor-owned second homes and short-term rentals. Did the OZ program make a difference on one side of the highway compared to the other? Or did those investors just get a lucky break with a forgivable loan from our Uncle Sam?
The overall lesson still generalizes beyond the mountains and plains. Colorado’s experience suggests that what separates a high-performing state from a low-performing one is less the raw quality of the tracts selected than whether the state built the connective tissue — technical assistance, local outreach, project preparation — that turns a tax incentive into actual deals.
Opportunity Zones are about building systems to connect people with communities, not just handing out tax incentives.

What Round One Teaches
For planners and economic developers, the lesson from OZ 1.0 is neither to dismiss Opportunity Zones nor to mistake designation for a development strategy. The first round moved an enormous amount of capital, built a substantial amount of housing, and raised the visibility of neighborhoods that investors had overlooked. It did not, on the best available evidence, reliably improve the employment, earnings, or poverty of the people who already lived in those neighborhoods — and in rural tracts specifically, the researchers found no positive labor-market effects at all.
The Colorado counterpoint sharpens the question rather than resolving it. A state that invested in technical assistance and project preparation achieved near-universal investment reach, including in rural tracts — even as the national labor-market research found no measurable rural employment gains. Both things can be true: capital can flow to places without measurably changing who holds the jobs. The next round, with its stronger rural incentives and its new reporting requirements, will be the test of whether better design closes that gap.
The questions worth carrying forward are sharper than the ones we asked in 2018. What would this investment make possible here — and how would we know local people benefited?
This is the second post in a series on Opportunity Zones. The first, an introduction to the OZ program, is here. The next post will look at how communities are preparing for the new round.
Resources
- Treasury OTA working paper on OZ investment (via EIG summary)
- NBER Working Paper 34589: Understanding the Employment Effects of Opportunity Zones
- NBER digest summary of employment findings
- EIG research brief: Are Opportunity Zones Working?
- EIG: Opportunity Zones 2.0 — Where Things Stand
- Urban Institute: An Early Assessment of Opportunity Zones for Equitable Development Projects
- Illinois DCEO whitepaper on Opportunity Zones in Illinois
- OEDIT FY 2022–2023 annual report (Colorado OZ lessons learned)
- Colorado Sun: Gov. Polis picks 91 Colorado regions for new Opportunity Zone round
- OpportunityZones.com podcast: Inside Treasury’s $112 Billion Opportunity Zone Report
- HUD: Opportunity Zones Best Practices Report
- HUD: Opportunity Zones Updates and OZ 1.0 vs. OZ 2.0 comparison
- Accelerator for America: Opportunity Zones Research Landscape Scan
- CDFA Opportunity Zone Resource Hub
- Novogradac Opportunity Zones Resource Center (source for map above)
- OpportunityZones.com
- OZfile
- Rural Opportunity Zones 2.0
.
