
You’ve seen the headlines—in print or online—heralding the impending doom of Rural America (or Canada, or Australia, or wherever you call home).
- “Rural America Is Hardest Hit by Residents Fleeing, New Data Shows” (Realtor.com 3.25.26)
- “The role of farming in the exodus of rural America” (Ecdysis Foundation 6.19.25)
- “Small town Canada is dying. This is sad. But it’s not tragic.” (Maclean’s 4.20.18)
When I see click-bait like these (hey, even online newspapers have to sell content) I try to pause, breath deeply, and try to work out the context.
- The Realtor author highlights 10 counties with the greatest RATE of population contraction from 2023 to 2024—5 in the Mississippi Delta region and a couple more in Alabama and Georgia, all areas of persistent poverty; a couple on the west coast, one in the rust belt of northern Indiana. Counterpoint—this is a one-year snapshot in time, and small changes on a small population base can look like a fairly large percentage drop (or gain).
- The farming article is based on long-term changes in agricultural technology going back to the late 1800s, citing statistics from the 1980s through 2010s. Nothing new here, and the author does then pivot to “How do we rebuild our communities”.
- The Maclean’s piece reads like an essay or op/ed—hard to tell as it’s not labeled as such. The subhead gives away the author’s bias: “The truth is that Canadians live healthier, happier and longer lives in cities” with no data to support the position.
OK, whatever. But what do the data say? How do we gain a better understanding of our local rural economies?
Let’s talk about that.
Note: I am not an economist. I am not a statistician. I check my economic development analysis textbook every time I do this sort of work. Measure twice, cut once.
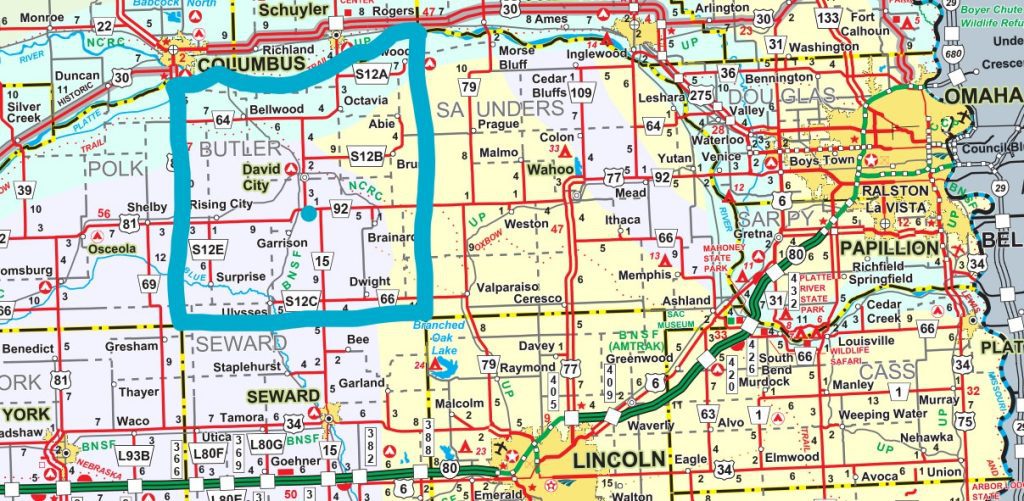
A Typical Entry in the Rural Economic Development Field Book
Butler County, Nebraska
In early February, we discussed demographic trends in the US and around the world. Then in the first installment of our March series on economic development, we discussed some common sources of economic development data, building on our discussion of demographics in February.
When we add analysis to data, we get information—some of which may actually be useful.
Today, I want to tell you about some of my go-to data sources for economic development. This include the US Census Bureau’s American Community Survey (ACS), US Census Bureau’s County Business Patters (CBP), BLS Quarterly Census of Employment and Wages (QCEW), BLS’ Local Area Unemployment Statistics (LAUS), and BEA Personal Income by County, was well as a slew of data and reports from the USDA Economic Research Service (ERS).
You may recall, in our last post, we pulled a high-level sample from the Center on Rural Innovation (CORI) data tool, the Rural Economic Development Toolkit, for my current home in Butler County, Nebraska. We also should have mentioned Headwaters Economics and their Economic Profile System—I am a long-time fan.
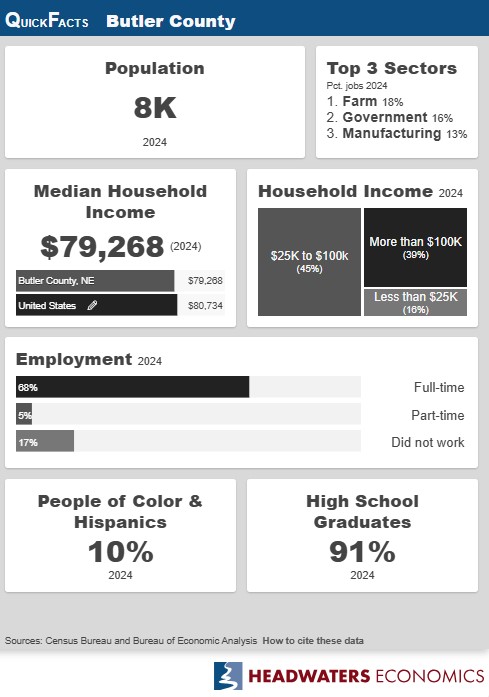
Let’s take a closer look at what these sources say about the local economy here in Mid-America, today and over the last decade or two. In context it is helpful to note Butler County was created in 1856, when Nebraska was still a territory, and was organized in 1868, the year after statehood. Over time, a dozen municipalities sprang up along the railroads through Butler County, including the county seat of David City, home of my employer Marvin Planning Consultants. Butler County is organized with Township government and a Board of Supervisors.
Oh, and please excuse the standard Excel charts and graphs and variety in typography. I’m going for illustrative volunteer chic, not consultant spit and polish here.
US Census Population Counts
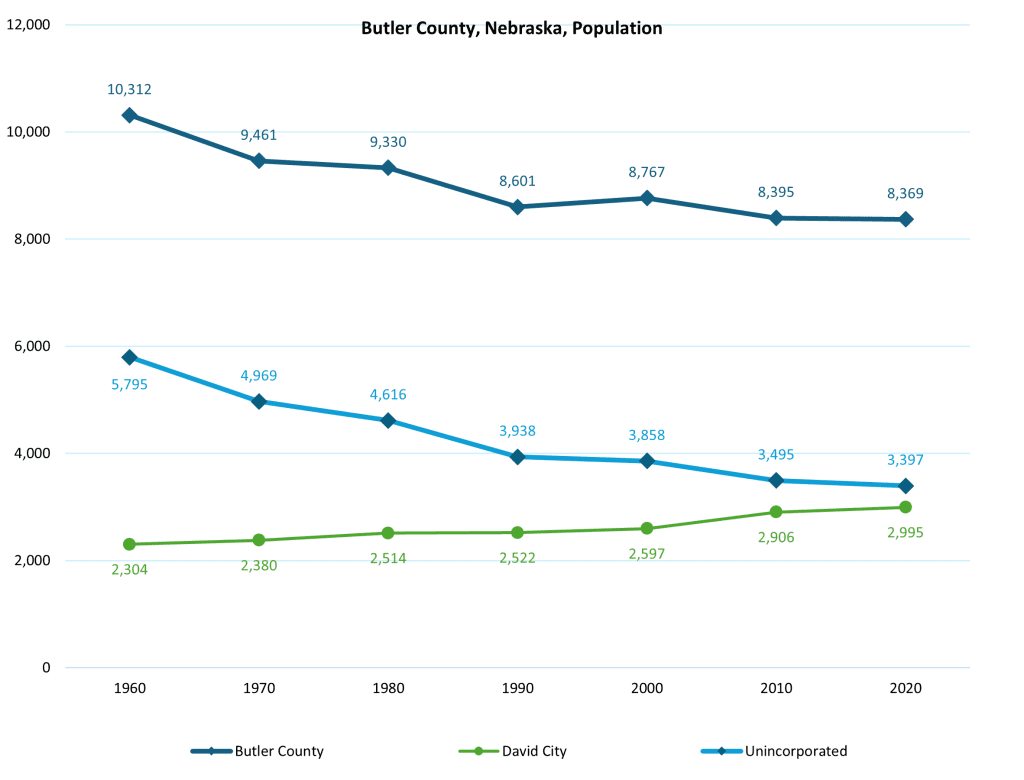
The U.S. Census is a constitutionally mandated, once-a-decade count of every resident in the United States, conducted since 1790. Butler County was first enumerated in the US Census of 1860 with a grand total of 27 residents. In 1870, there were 1,290, and as the railroads crossed the county and immigrants took up homesteads, the population peaked in 1900 at 15,703. By 1970, there were fewer than 10,000 residents. The population grew from 1990 to 2000, then declined through 2020.
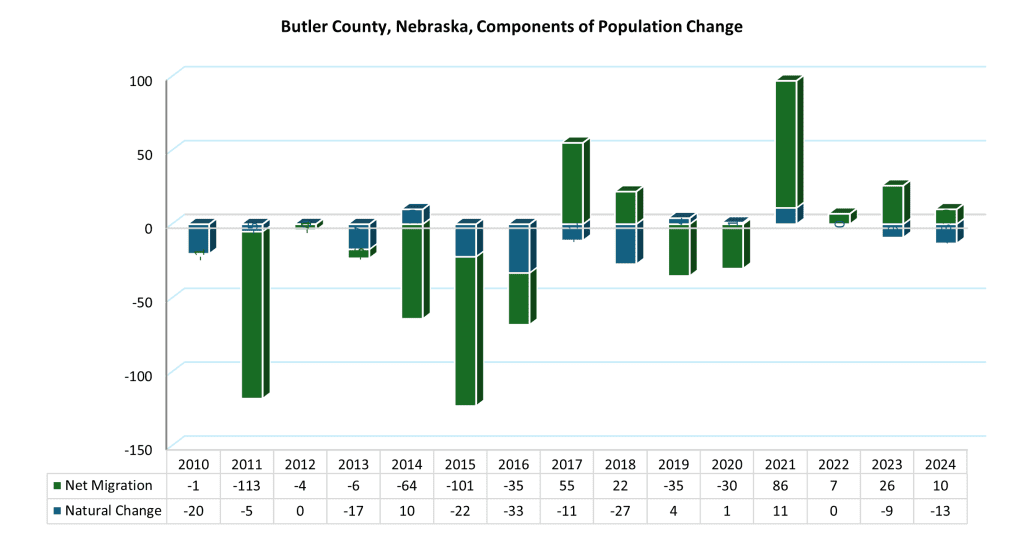
The US Census Bureau also works with states and the entire Census data network of demographers and statisticians to provide annual population estimates, based on a variety of sources. The latest estimates Butler County’s population at 8,439, a slight bounce back from the Decennial count—including my own family since we moved here. The Bureaus’ estimates of the components of population change shows consistent pressure of natural change buoyed by migration.
This population pattern mostly supports the doom-and-gloom scenario. Yet looking more closely we can see the county’s population has followed a familiar pattern. While Butler County overall has fewer residents as farm families became smaller and more spread out, the population in town has remained remarkably stable since the early 1900s. Some villages have gained, while others contracted, and the county seat—the largest municipality—has grown, not by much, but consistently over time.
You can find recent US Census data for your community online at the Census Bureau’s website, and increasingly through the data tool at https://data.census.gov/ .
American Community Survey (ACS)
The American Community Survey (ACS) is the Census Bureau’s ongoing, nationwide survey that replaces the old “long form” and provides annual estimates on key social, economic, housing, and demographic characteristics for every place in the United States, including counties and cities. Outside major metropolitan areas, the ACS reports 5-year estimates, which pool data across a number of years to produce statistically reliable figures for low-population areas. (Metro and state data is available in one-year estimates.) The ACS estimates are not perfect, but they are often the best data we can get for rural places.
ACS is an ongoing survey conducted by the U.S. Census Bureau since 2005. Data sets are available back to 2010 (2006-2010 rolling average survey). General Data Profiles are general sources reporting on social, economic, housing, and demographic characteristics for places of all sizes. The Census Bureau’s data.census.gov will also return over 1,000 detailed tables for all sorts of comparisons, although individual data points may have large margins of error or be omitted for non-disclosure in small towns and low-population counties.
Demographics
Looking at the Data Profiles for Butler County, Nebraska, we can see how estimated population characteristics have changed over time. and in comparison with other areas. A useful statistic is the average household size: in Butler County, the average household increased from 2.29 people in 2014 to 2.35 in 2024. This compares to the State of Nebraska at 2.47 in 2014 and 2.42 in 2024—you want to make sure you’re comparing like surveys, so use the longer 5-year averages to compare a rural county with a state-wide average. This data appears to show Butler County is attracting larger families, while statewide families are getting smaller; this may indicate a need for larger homes to be competitive for workforce housing.
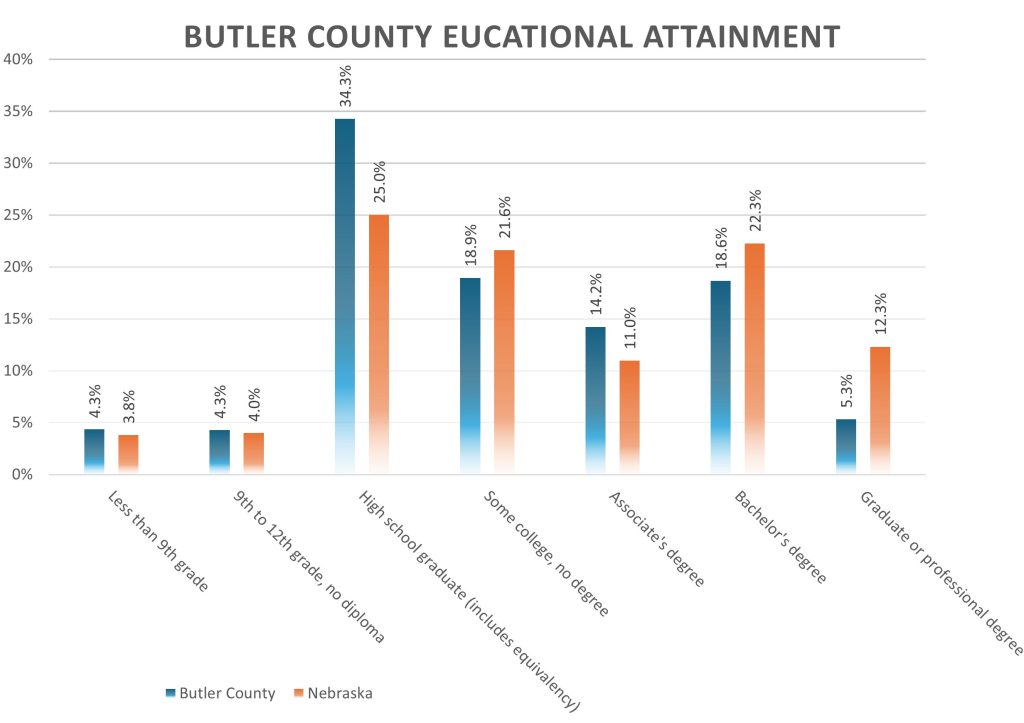
As we saw last week in the CORI summary data, Butler County generally has lower educational attainment than is average across Nebraska. However, ACS also reveals a greater share of local residents have completed an Associate’s degree than typical, indicating the local workforce may have more practical skills than average.
Households and Housing Units
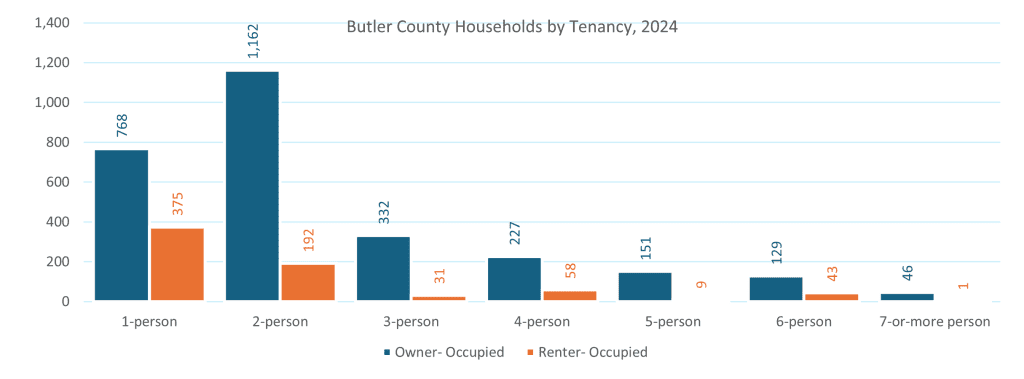
The ACS offers a wealth of household and housing information for cities and counties. It is important to know where your workforce is living and your competitiveness for growth. For instance, the total number of households in Butler County decreased from 3,556 in 2014 to 3,524 in 2024, yet the number of persons in households grew as fewer people lived in group quarters like nursing homes. About 40% of Butler County’s owner-occupied household consisted of only two-people, while the majority of renter households were only one-person.
The overall number of housing units increased slightly from 2014 to 2024, although the number of occupied units fell slightly. The number of owner-occupied housing units grew while rental units fell county-wide. The number of single family detached homes contracted by 1%, while the number of single-unit attached housing units doubled—admitedly from a small base. Unfortuantely, other “Missing Middle” house-sized units (3 to 20 units per structure) fell across the board.
ACS reports purported reasons for vacancies, but with low response rates and limited field checks by staff, I generally don’t give that data set much weight. As these numbers tend to have a high margin of error in small towns and rural counties, this type of trend may spur your economic development organization to participate in updating the local housing study to maintain competitiveness to attract the workforce your employers need available.
Employment and Income
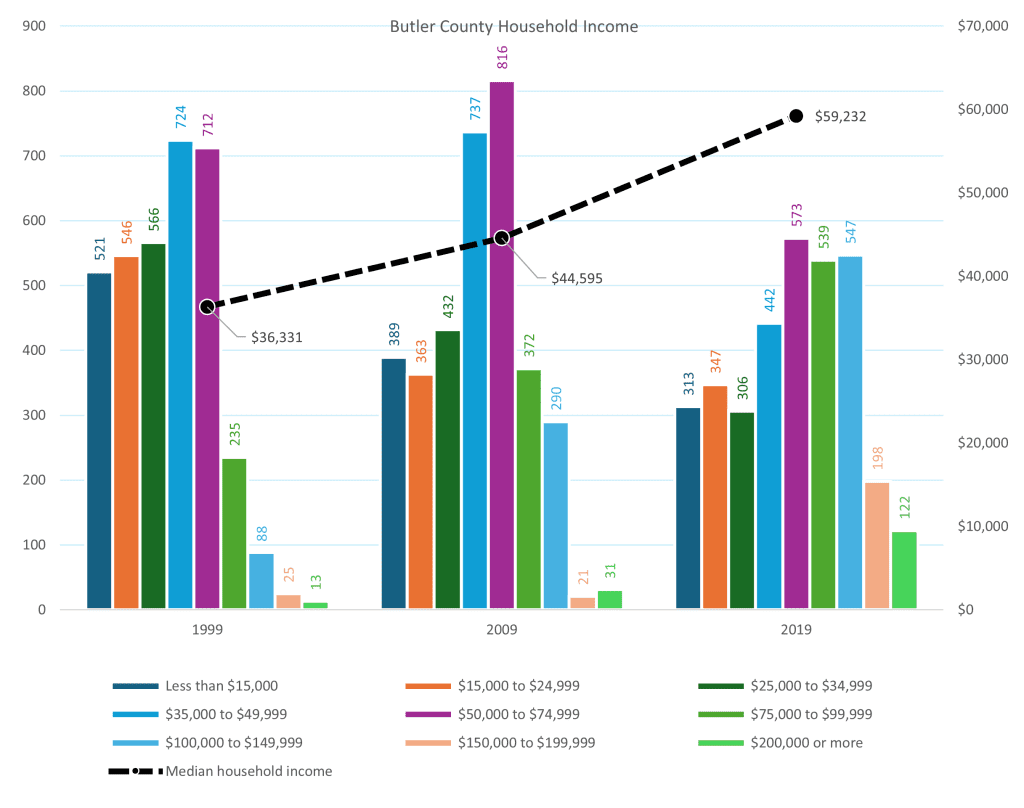
In economic development, we are concerned with local jobs and income. The Census reports income as survey respondents enter for the year prior to each survey. Before 2010, the Decennial Census long form reported Median Household Income every 10 years. In 1999, Butler County had a median household income of $36,331, compared to $39,250 in Nebraska. The county’s figure twenty years later rose to $59,232 compared to the state’s $63,015 (as reported in the ACS 2016-2020). While still below the statewide average, Butler County’s household income actually rose at a faster rate than the state over the same 20 year period. Progress is being made.
The same as there are other sources of data on income, discussed below, there are multiple sources of data on employment. Census data, however, are based on where people live, compared to other sources based on where they work. This can be a useful metric to understand where we can work to balance jobs, workforce, and housing. The ACS reported the employed population 16 years old and over rose from 4,273 in 2014 to 4,358 in 2024, even as the estimated population fell. Like in many rural counties, the largest industry is educational services and health care, yet there is also a very strong manufacturing sector locally.
ACS also reports data on the journey to work. Special tables will tell you what the survey sample report for how long it takes to commune. In Butler County’s 2024 survey, over half of respondents worked outside the county, while other Census reports indicate up to 2/3 of residents commute outside the county. Either figure is not surprising given the proximity of major employment centers to the north (the cities of Columbus and Schuyler) and to the south-east (Lincoln and Omaha metro areas). At the same time, 9.5% reported working from home and 21.1% have a commute of 10 minutes or less.
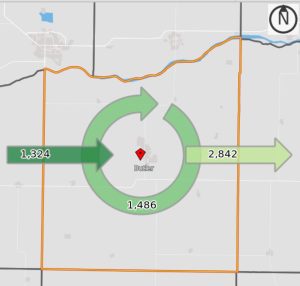
The Census On The Map tool is a web-based mapping and reporting application that shows where workers are employed and where they live. This app is part of the Longitudinal Employer-Household Dynamics (LEHD) program, which also provides apps for emergency management and other uses. This tool indicates daily commuting patterns as of 2023:
- 1,324 workers commute into Butler County
- 1,486 Butler County residents also work in their home county
- 2,842 Butler County residents leave the county to go to work
On the Map also shows about ¼ of Butler County’s employed residents work in David City (the county seat). Just over 13% work in Lincoln, the state capital to the southeast on I-80, while 12% work in Columbus, just to the north across the Platte River, followed by Omaha to the east, Seward to the south, and Schuyler to the northeast across the Platte River.
County Business Patterns (CBP)
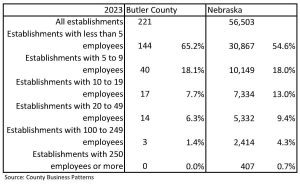
County Business Patterns (CBP) is an annual Census Bureau data series that provides detailed, subnational snapshots of the business economy by reporting the number of employer establishments, employment during a reference week in March, and first‑quarter and annual payroll for industries classified by NAICS at the national, state, county, metro/micro, and ZIP code levels. Drawn primarily from the Census Bureau’s Business Register, it covers millions of single- and multi-unit establishments with paid employees, organized into nearly 1,000 industry categories and, at most geographies, broken out by establishment employment-size classes. These data exclude most government employees and the self-employed but serve as a standard source for tracking local industry mix, business concentration, and job structure over time for economic development, market analysis, and policy evaluation.
The most recent data is for 2023, when CBP reports there were 221 establishments in Butler County, Nebraska, with an annual payroll for approximately $123,596,000 and 1,967 employees. Two-thirds of establishments have less than five employees, and 18% reported they had five to nine employees. Stateside, about 55% of establishments have less than five employees and 18% also report in at 5 to 9.
In contrast to ACS’ place-of-home statistics, CBP should represent place of employment. Standard reports break down data further by standard industrial classifications (NAIS codes). CBP may offer a greater level of detail than some other reports, although small data sets are subject to non-disclosure for privacy concerns.
Bureau of Economic Analysis (BEA)
Personal Income by County
The US Bureau of Economic Analysis (BEA) Personal Income by County statistics provide annual measures of total and per capita personal income for every U.S. county, capturing what residents receive from wages and salaries, proprietors’ income, dividends, interest, rent, and government transfer payments, with income assigned to the county where people live rather than where they work. BEA publishes detail by major income components (for example, farm and nonfarm earnings, transfer receipts, and investment income) and per capita personal income, allowing analysts to distinguish rural places where income growth is driven by farm earnings, retirement and disability benefits, or nonlabor income such as dividends and rents.
Because this income data are benchmarked to national and state accounts, they offer a consistent long-run time series back to 1969 and support direct comparisons of income levels and growth between metropolitan and nonmetropolitan counties, which BEA routinely summarizes in its releases (for example, noting that personal income growth has at times been faster in the nonmetropolitan portion than in metros).
For rural counties, this residence-based approach is especially important because many workers commute to jobs in nearby towns or metros, so the series reflects the resources available to rural households even when earnings are generated elsewhere.
Total Personal and Per Capita Income
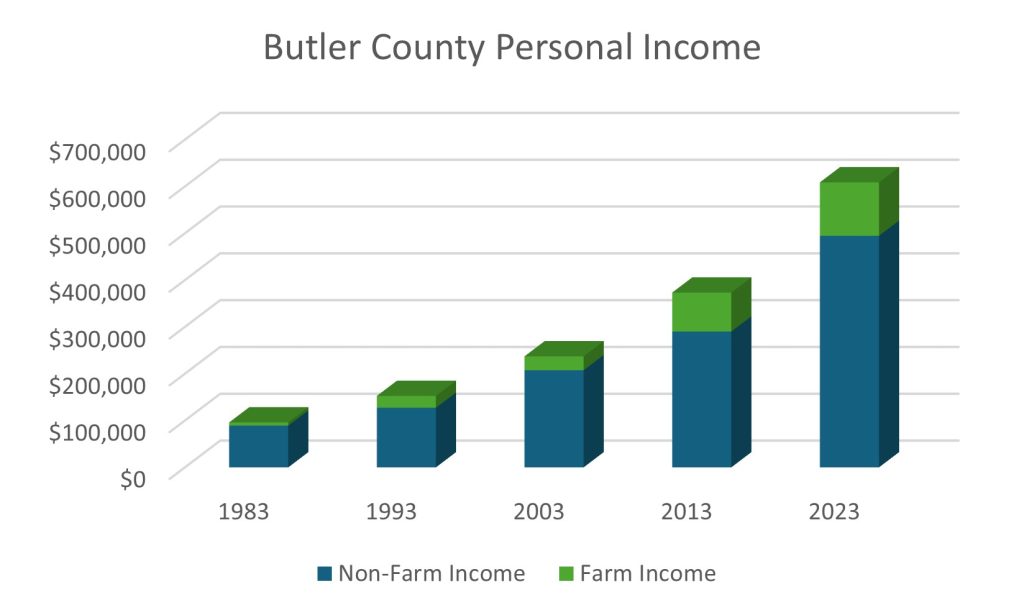
The aggregate charts indicate total personal income in Butler County has increased by over 500% from 1983 to 2023. Overall declining population results in Per Capita Income (PCI) rising even faster—while Butler County lagged the statewide indicator for most of the record, in 2023, the county’s PCI of $71,971 was greater than Nebraska’s PCI of $71,347. I doubt most local residents consider their county among the state’s “wealthier” communities.
In farming dependent counties, we ought to keep mind that spikes low and high in Farm Income can make these figures highly volatile. Depending on the time series, many rural counties have experienced negative net farm income, which really throws off the statistical comparisons. We should also keep in mind, while Farm Income is basic income—all new money coming into the local economy, Farm Income itself tends to be a rather small share of overall income, especially in more diversified communities.
Transfer Payments
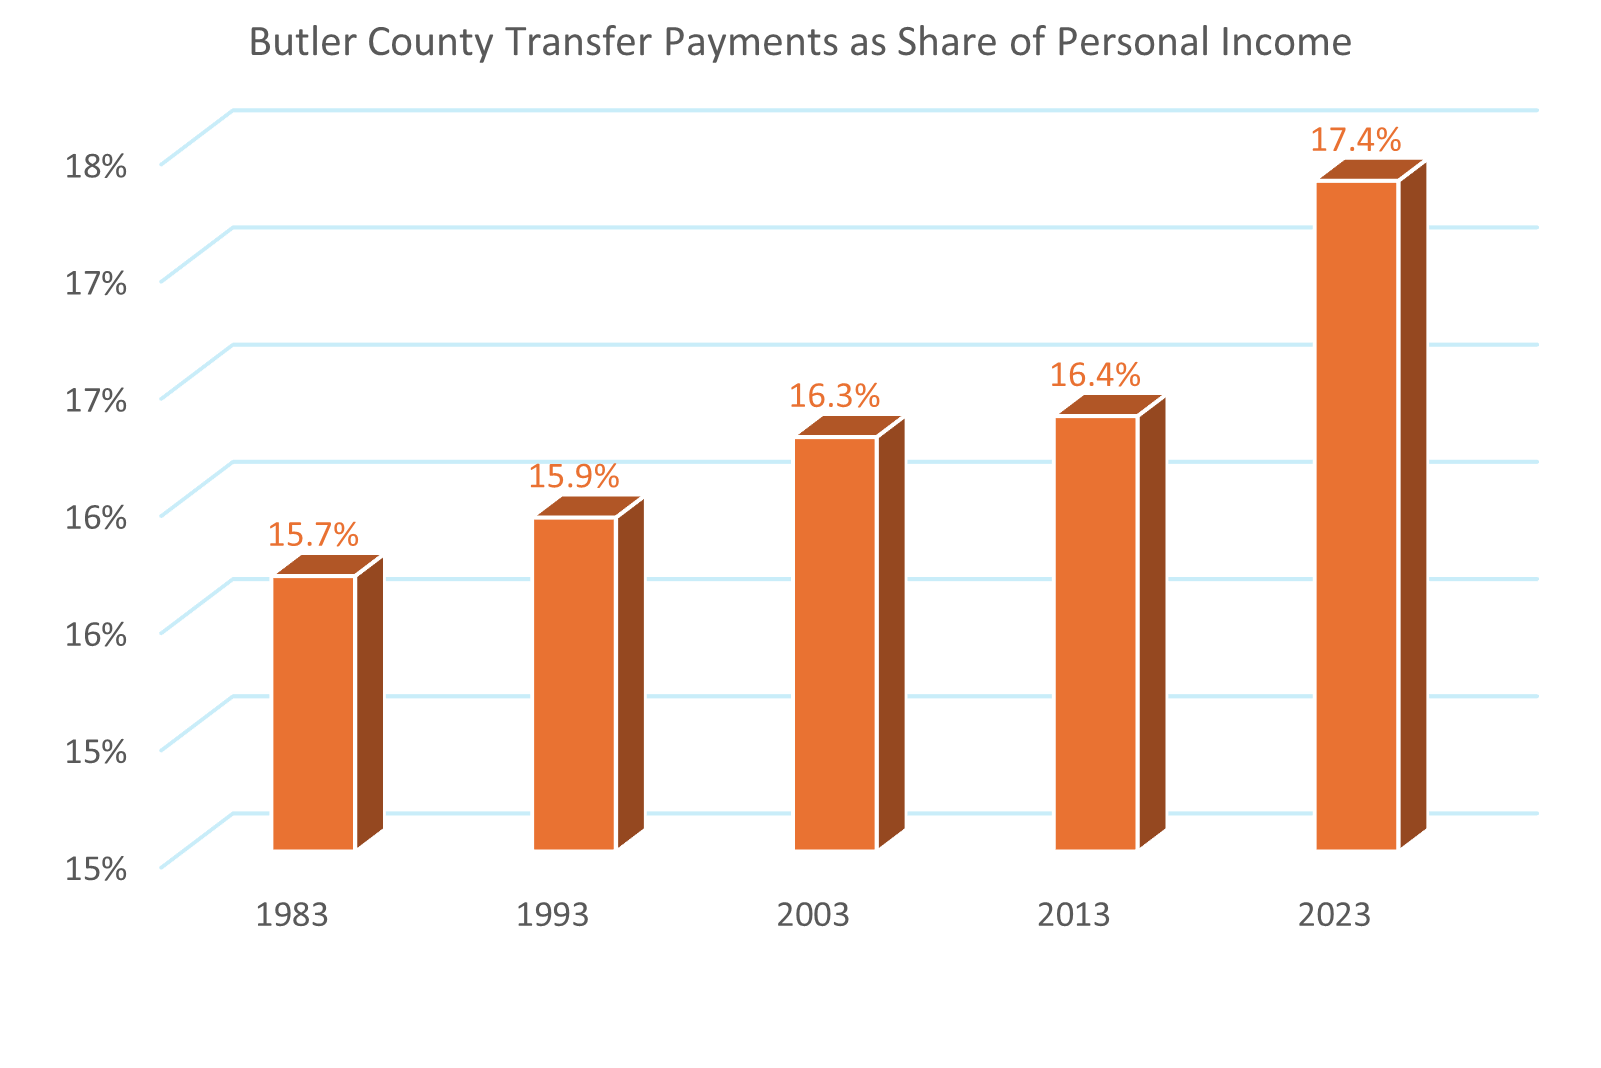
Another increasingly impactful factor is Transfer Payments. While the recent pandemic resulted in a spike in transfer payments, in particular from tax credits and medical beefits, the trend has been an increasing share of personal income overall is made up of transfer payments, nationwide. Current transfer receipts grew from 14% in 1992 to 18% in 2002, where it stood through 2022, due in part to overall growth in personal income in the county. Unfortunately, this data series has been discontinued for rural counties, so we won’t be able to track this metric as easily going forward.
Employment by County
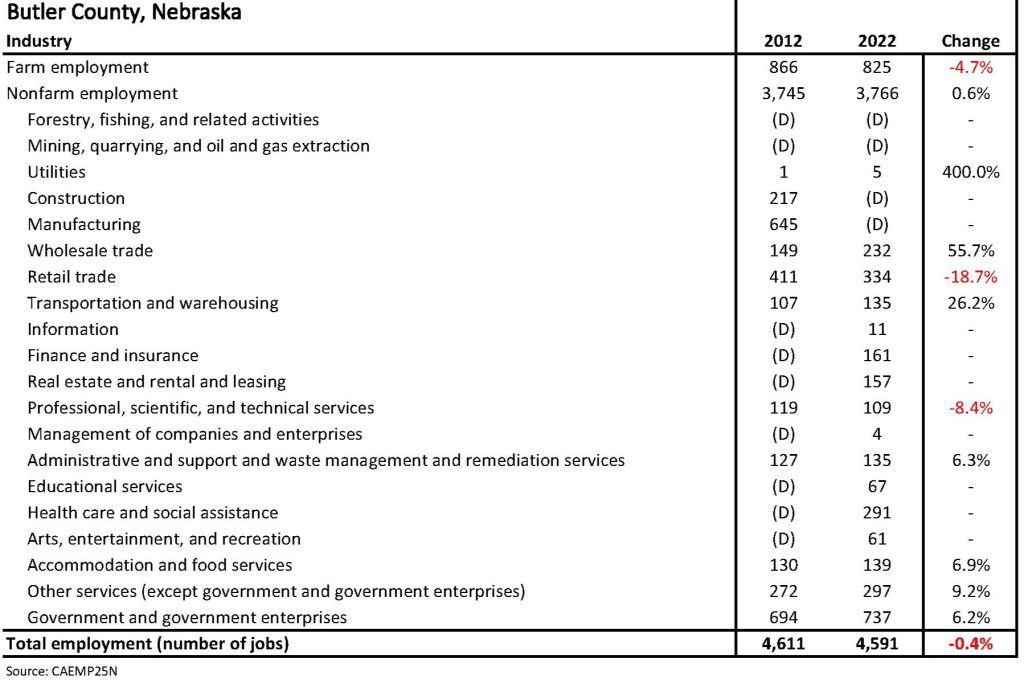
BEA has historically reported employment by county in the CAEMP25 table series, titled “Total full-time and part-time employment by industry,” as part of the Regional Economic Accounts. This table reported the number of jobs—counting both full- and part‑time positions, and including wage‑and‑salary workers plus proprietors—by detailed NAICS industry for each county, with consistent geography and industry definitions from 2022 back to 1969 (SIC historically, then NAICS). CAEMP25 was widely used to profile local industry mix, compare BEA’s job counts with BLS QCEW employment, and build input data for regional economic models, because it captured sectors often underrepresented in payroll-only data, such as farm and nonfarm self-employment, small proprietors, and certain government components.
BEA’s employment by industry figures has been one of my go-to data series, due to consistency over time. That said, rural counties are plagued with non-disclosure for smaller industries, limiting the usefulness of the data series. For Butler County, Nebraska, only 11 of 20 standard NAICS codes were disclosed in 2012, although all but four were reported in 2022, on a slightly smaller employment base.
In 2012, Butler County was reported to have 4,611 jobs, which contracted by -0.4% to 4,591 in 2022, the last year for which the report was published. Of these jobs, nonfarm employment grew by 0.6% nd reported farm employment fell by -4.7%. In contrast to Census employment by residence, the largest industry reported was government and government enterprises, followed by retail trade and health care/social assistance. Smaller places tend to have proportionally more employment in government services.
Location Quotients and Shift-Share Analysis
I also tend to use this series to calculate Location Quotients and Shift Share analysis.
A location quotient (LQ) tells you if your town has “more than its share” of a certain kind of job.
- First, you find the share: “What percent of all jobs in our town are in this industry?”
- Then you compare it to the State or the US nationaly: “What percent of all jobs in the state/country are in this industry?”
- If the number you get is about 1, your town is pretty normal for that industry.
- If it is bigger than 1 (like 1.5 or 2), your town is extra strong in that industry, which might mean it’s an export or “base” industry that sells to people outside the area.
- If it is less than 1, your town has less of that industry than normal, and probably buys a lot of those goods or services from other places.
For example, if 20 out of 100 jobs in your county are in manufacturing, but only 5 out of 100 jobs in the state are in manufacturing, your county is much more “manufacturing‑focused” than the state overall. I tend to use the state of Nebraska as a comparison to Nebraska counties, as I compared North Dakota counties to the State of North Dakota overall, etc.
In 2012, Butler County shows a high LQ of 1.78 in manufacturing. In 2022, this sector is not disclosed, likely because we are home to one manufacturer of truck trailers which likely dominates this statistic. Services and government were also above average in 2012. More recently, in 2022, Wholsesale Trade was the high LQ (with manufacturing not disclosed), followed again by government and other services. All other industries were under-represented locally.
Shift–share then is like asking, “Why did our town’s jobs change the way they did?”
Think of it as splitting job change into three “slices”:
- State/National growth effect – How many jobs would your town gain or lose if it grew just like the whole state or country?
- Industry mix effect – Did your town have more jobs in fast‑growing industries (like tech) or slow‑growing ones (like a shrinking factory industry)? This tells you if you’re in the kinds of industries.
- Regional (competitive) effect – After you account for the first two, is your town doing better or worse than expected? If you have more job growth than the national pattern suggests, you may be especially competitive or attractive for that industry.
For economic development, people use location quotients to see what their local strengths are now (what they’re “good at”) and shift–share to see how and why things are changing over time, so they can decide which industries to support, grow, or help diversify.
Butler County’s employment may have contracted from 2012 to 2022, but shift-share analysis gives us hints about local opportunities to grow. That said, while utilities gained more than it’s share the numbers indicated growth from 1 job reported to 5—as we the local Public Power District is headquartered in the County Seat, I’m guessing their employment may be reported as a government enterprise, since Nebraska is a public power state. This is another reminder to go beyond the headlines and try to better glean information from your data.
Federal Budget Cuts at BEA
The BEA data overall will be less useful for rural counties in the future. Several BEA county‑level data sets have been discontinued or materially cut back in the last couple of years, mainly because of Federal budget constraints. BEA discontinued CAEMP25 after 2022, as part of broader cuts to the Regional Economic Accounts. This means we have limited industry-level county employment or average earnings-per-job updates for 2023 going forward. Users must now turn to alternatives such as County Business Patterns, QCEW, state labor market systems, or third‑party reconstructions that extend the historical CAEMP25 series.
In November 2024, BEA also stopped publishing two key county tables for personal income: CAINC35 (detailed personal current transfer receipts) and CAINC45 (detailed farm income and expenses), which had provided rich detail on program benefits and farm components that are especially important in many rural counties.
As well, this year BEA discontinued publishing statistics for county aggregate geographies—including metropolitan and micropolitan statistical areas—so metro/nonmetro comparisons now have to be built by users aggregating county data themselves. This pushes more of the burden for constructing rural indicators onto users or intermediaries like StatsAmerica and IMPLAN.
Bureau of Labor Statistics
BLS Quarterly Census of Employment and Wages (QCEW)
The US Bureau of Labor Statistics’ Quarterly Census of Employment and Wages (QCEW) is a near-universal count of jobs and wages based on unemployment insurance records, providing detailed quarterly and annual statistics on employment, establishments, and total/average wages by industry for every county, state, and the nation. Because it is administrative rather than survey data and covers more than 95 percent of all nonfarm wage-and-salary jobs, it offers especially reliable measures for small and rural counties where sample-based series can be unstable.
For rural analysis, QCEW’s county-level industry detail (by NAICS), coupled with average weekly wage measures, allows researchers and planners to track the structure and pay of local labor markets, identify dominant sectors (for example, agriculture-related processing, health care, or tourism), and compare rural areas with nearby metros over time. However, it excludes most self-employed workers, unpaid family workers, and many agricultural and informal jobs, so in rural economies with substantial self-employment or farm work, QCEW undercounts total labor activity even while remaining the core benchmark for the employer side of the rural economy.
As you might guess from the title, QCEW does report quarterly statistics. I usually use the Annual Averages, though, for county-level analysis. For Butler County in 2024, BLS QCEW reported an annual average of 276 reporting estabishments with employment of 2,629. Of these establishments, 10 were Federal government agencies, 4 State government, and 30 Local government. Drilling down a bit on local government, we might be able to interpolate the scale of the local Public Power District employment, but most of these are cities, villages, and school districts.
For the private sector we can compare employment by industry between BEA and BLS. While QCEW has fewer high level NAICS-based categories, so should have less data hidden by non-disclosure concerns, in the case of Butler County employment is still not disclosed for construction and manufacturing.
BLS Local Area Unemployment Statistics (LAUS)
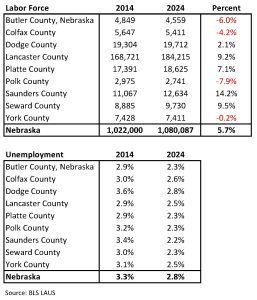
The BLS’ Local Area Unemployment Statistics (LAUS) program is a federal–state effort that produces monthly and annual estimates of the civilian labor force, employment, unemployment, and unemployment rate for states, metros, micropolitan areas, counties, and other local geographies, using concepts consistent with the national CPS-based unemployment rate.
Like the QCEW, LAUS does not rely on a local household survey. Instead, BLS and cooperating state agencies use a “Handbook” or building‑block method that combines multiple data sources (such as QCEW and CES employment, unemployment insurance claims, ACS commuting patterns, and population estimates) to construct place‑of‑residence estimates that are then forced to match more reliable state totals. For rural counties with small populations and thin survey samples, this allows comparable data sets with a consistent, comparable official unemployment rate each month. A word of warning, though, as the estimates are model‑based and can be volatile or subject to revision, so analysts often focus on longer-term trends or 12‑month averages when assessing rural labor market conditions. In fact, we’re seeing all sorts of turmoil in official employment and unemployment reports nationwide, so take the numbers as estimates all around.
In 2014, Butler County had an average annual labor force of about 4,849 people, of whome 4,707 were employed, resulting in an unemployment rate of 2.9%. That compared to 3.3% unemployment in Nebraska statewide. In 2024, the labor force shrank to about 4,559, with 4,456 people employed, for an unemployment rate of 2.3%. The Nebraska unemployment rate was 2.8% that same year.
The local unemployment rate went down, due to losing labor force, not necessarily from increasing jobs. While each of the surrounding counties experienced a lower unemployment rate from 2014 to 2024, some grew their labor force, while others contracted. Lower unemployment makes a good headline, but may not be a healthy economic indicator.
USDA Economic Research Service (ERS)
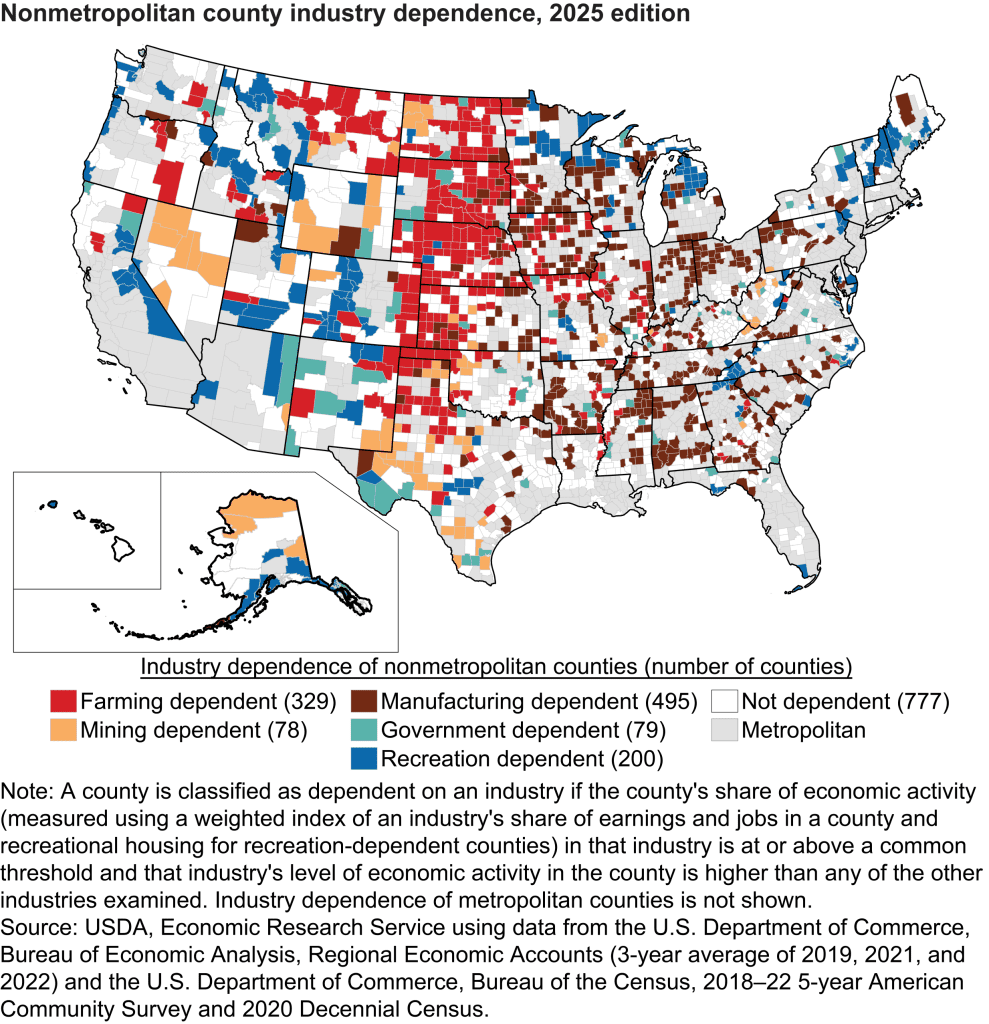
USDA’s Economic Research Service provides several county-level economic datasets that are especially useful for understanding rural conditions, most notably its County-level Data Sets and County Typology Codes.
The County-level Data Sets compile harmonize annual indicators for every county—including poverty rates, unemployment and median household income, population levels and change, and educational attainment—drawing on sources such as Census SAIPE, ACS, LAUS, and Population Estimates, and packaging them into a single set of Excel/CSV files that also include rural–urban classifications like Rural–Urban Continuum Codes and Urban Influence Codes. These files are widely used in rural analysis because they provide ready-to-use, consistently formatted socioeconomic time series for all counties, making it easy to compare rural and urban counties within and across states.
ERS’s County Typology Codes add another layer by classifying counties into economic types (for example, farming-, manufacturing-, mining-, government-, or recreation-dependent) and demographic types (such as retirement destination, persistent poverty, low employment, or population loss), with a particular focus on nonmetro counties’ industrial structure and social challenges. Butler County, Nebraska, is considered a High Farming-Concentration county, along with 453 other counties across the US. Not all rural counties are in this topology, but there are also about 44 metro counties also in the category, especially in locations across the Midwest and Great Plains.
Together with ERS’s State Fact Sheets and the Atlas of Rural and Small-Town America, these products give researchers and planners a compact toolkit for profiling local economies, targeting distressed areas, and tracking how rural counties are changing over time.
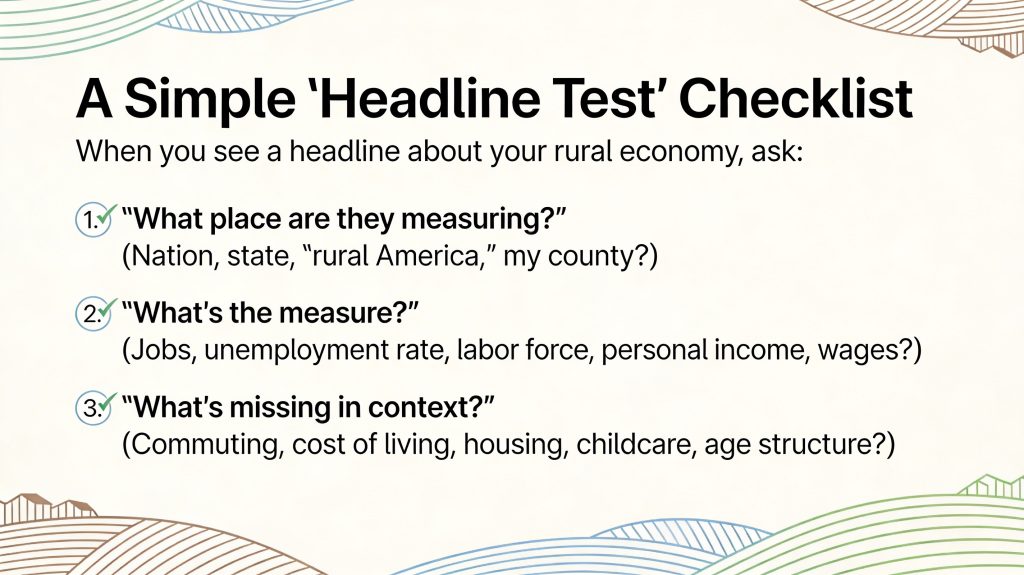
A Simple “Headline Test” Checklist
When you see a headline about your rural economy, ask:
- “What place are they measuring?” (Nation, state, ‘rural America,’ my county?)
- “What’s the measure?” (Jobs, unemployment rate, labor force, personal income, wages?)
- “What’s missing in context?” (Commuting, cost of living, housing, childcare, age structure?)
Most folks are not as fascinated by the ins-and-outs of demographic and economic statistics as I am. I get it. But it’s a good ideas to be familiar with the numbers behind the headlines.
Headlines will keep declaring that Rural America is dying, disappearing, or circling the drain. They make for good copy. But Butler County’s story—and your county’s story—doesn’t fit neatly in 10 words at the top of a printed page, or a web page for that matter.
When we walk through the data, we see something different. We see long arcs of population and short bursts of change. We see towns that hold steady while the countryside thins out. We see households getting a little bigger, incomes rising faster than we might expect, transfer payments filling more of the gap than most people realize. None of that shows up in a doom‑scroll headline.
So here’s my ask: The next time you see “Rural America is dying” in your feed, don’t just share it—ground‑truth it. Pull up Census or ACS for your county. Look at BEA personal income, or a Headwaters or CORI profile. Ask what’s really happening with jobs, wages, and income where you live, not just what someone says is happening somewhere “out there.”
Because understanding your rural economy is not a one‑time report or a single number. It’s a habit of mind. It’s choosing to look under the hood, to question the easy narrative, and to listen to what the data and your neighbors are both trying to tell you. If you start there—one county, one table, one conversation at a time—you’ll be miles ahead of the headlines.
If you had to pick one local number you’d like to understand better in your own county—population, jobs, wages, transfer payments, or something else—which one would it be?
Next week we’ll dive into entrepreneurship, plus retention and expansion, as the core of local economic development.
Resources
Books
- Big Data for Twenty-First-Century Economic Statistics by Abraham, Jarmin, Moyer, & Shapiro (University of Chicago Press, 2022) eTextbook – pricey so check interlibrary loan.
- A Guide to Everyday Economic Statistics, 8th Edition by Clayton, Giesbrecht, & Guo (McGraw Hill, 2018) eTextbook
- Local Economic Development: Analysis, Practices, and Globalization, 2nd Edition by John P. Blair and Michael Charles Carroll (SAGE Publications, Inc., 2008) eTextbook
- The Community Economic Development Handbook: Strategies and Tools to Revitalize Your Neighborhood by Mihailo Temali (Fieldstone Alliance, 2002)
- The Nature of Economies by Jane Jacobs (Random House Canada, 2000)
- Cities and the Wealth of Nations: Principles of Economic Life by Jane Jacobs (Random House, 1984)
- The Economy of Cities by Jane Jacobs (Vintage / Ebury, 1970)
- Proudly Made: A Memoir by Tataboline Enos (Catamount Press, 2025). YES, an endorsement, even though this is not strictly an economic development book, Ta offers some profound insights on life and the economy of rural America.
- The New Geography Of Jobs by Enrico Moretti (Houghton Mifflin Harcourt, 2012)
Links
- US Economic Development Administration (US EDA): https://www.eda.gov
- National Association of Development Organizations (NADO): https://www.nado.org
- International Economic Development Council (IEDC): https://www.iedconline.org
- APA Economic Development Division: https://economic.planning.org
- National Rural Economic Developers Association (NREDA): https://www.nreda.org
- University Economic Development Association (UEDA): https://www.universityeda.org
- Economic Developers Association of Canada (EDAC-ACDE): https://edac.ca
- Nebraska Economic Developers Association (NEDA): https://www.neda1.org
- Southwest Regional Development Commission (SRDC) Minnesota: https://www.swrdc.org
- Southeast Nebraska Development District (SENDD): https://sendd.org
- Southwest Tennessee Development District (SWTDD): https://swtdd.org
- The Center on Rural Innovation (CORI) Rural Economic Development Toolkit
- Headwaters Economics Economic Profile System
More from JCShepard(dot)com
2026: Bring Your Plans to Life – Monthly Themes Preview
RuralStrong Podcast (Season 1 Episode 36)
Now playing on Youtube (audio), Spotify, and Apple Podcasts (February 2026)
Rural-Ready Engagement: Practical Tools for Small Town Planners
 Watch the full replay: youtube.com/@Engaging-Communities (February 2026)
Community engagement can look very different in small towns and rural communities. This webcast was co-sponsored by the APA Community Engagement Interest Group and the Small Town & Rural Planning Division.
Popular posts on JCShepard.com
- Reviving Rural America: Why Heritage Tourism Is a Game-Changer Now (September 2025)
- How Small Towns Succeed: A Proven Playbook for Rural Action (November 2025)
- The Rural Comeback: How Small Town Innovation Sparks Growth (August 2025)
- How Small Towns Can Build a Strong Outdoor Economy Without Selling Out (June 2025)
Check out The 12 Planning & Sustainability Books You Need in 2026 and browse through the Small Town & Rural Community guides on our Resources page.
(As an Amazon Associate, we may earn commissions from qualifying purchases. Check your local library or bookshop, too.)
.

