
Demography is destiny, the old saying goes, but if the last few years have taught us anything, it is that destiny is rarely a straight line.
Demographic trends used to feel like slow‑moving background noise—births, deaths, and migration quietly nudging our communities from decade to decade. Now those same forces are front‑page news, from aging boomers and worker shortages to housing pressures and rural “brain drain.”
In this post to kick off February’s theme of demographics and housing, I wanted to pull some of that noise into focus, connect the dots between the U.S. numbers and global trends, and ask what it all means for planners, economic developers, and local leaders trying to steer their hometowns through a very different demographic era.
Today we will look at slower growth and rising diversity in the United States, how immigration and aging are reshaping “wealthier” nations, and why the rural‑urban demographic split looks so familiar whether you are in Nebraska, Nova Scotia, or Nagano. Along the way, I pose some practical questions that underlie this whole series: how do we turn all this population data—tables, charts, and projections—into information that helps real communities make better plans?
And what are plans and planning if not about the shape of the future?
Slower Growth, More Diversity
U.S. and global demographics are shifting toward slower growth, older populations, and sharper contrasts between countries with very low and still-high fertility. These trends have the potential for radical change in housing, economic development, and provision of public services. As retried economic developer Dean Barber wrote this weekend on Substack:
“The United States is entering a new phase of immigration and demographic change, and the effects are now visible in the data. Population growth has slowed sharply as immigration inflows have contracted and federal enforcement has expanded, reshaping labor markets, regional economies, and political debate.”
Historic Low Growth in the US
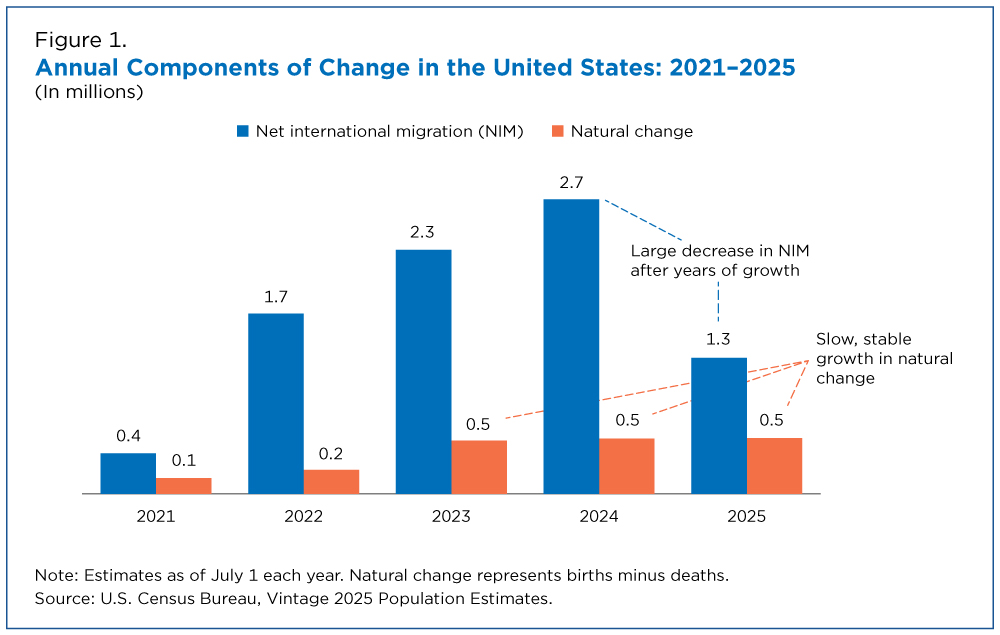
As of July 2025, the US had about 341.8 million residents. Population growth is now historically low in the US: current population gains are being realized where births still outnumber deaths and because of net immigration. Fertility has fallen below the “replacement” level of about 2.1 children per woman and is projected to stay low, meaning natural increase will keep shrinking without immigration.
In January, the US Census Bureau released state-level population estimates for 2025. Population growth in the United States has slowed significantly, showing only a small 0.5% gain last year. The slowdown is largely due to lower levels of net international migration.
“The slowdown in U.S. population growth is largely due to a historic decline in net international migration, which dropped from 2.7 million to 1.3 million in the period from July 2024 through June 2025,” said Christine Hartley, assistant division chief for Estimates and Projections at the Census Bureau, in a press release. “With births and deaths remaining relatively stable compared to the prior year, the sharp decline in net international migration is the main reason for the slower growth rate we see today.”
Even so, all but five states did increase their population last year. South Carolina grew the fastest at a 1.5% rate, with Idaho close behind at 1.4%. Texas added the greatest number of people in 2025. At the county level, estimates for 2024 show large metro areas like Houston (Harris County, Texas), Miami (Dade County, Florida), and Phoenix (Maricopa County, Arizona) grew by the greatest absolute numbers. Legacy cities like Memphis (Shelby County, Tennessee), St. Louis, Missouri, western Jackson (Hinds County, Mississippi), and New Orleans (Orleans Parish, Louisiana) lost the greatest number of residents year-on-year.
An Aging Population
The US population is aging quickly: the share of people 65+ is rising as baby boomers move into retirement ages and younger cohorts are comparatively smaller. Maine (23.5%–24%), Vermont (23%), and West Virginia (22%) hold the highest shares of elderly population.
Utah (12%), Texas (14%), and Alaska (15%) have the smallest shares of adults 65+. Youth numbers across the US are flat or declining overall, with an absolute decline in the under‑18 population since 2020; smaller numbers are concentrated among White youth.
The U.S. working‑age population is still growing, but much more slowly; projections to the 2050s by the US Congressional Budget Office show total population rising while the average age increases and baby boomers age out of the workforce. This projection, published in January of this year, assumes continued net immigration, though.
Diversity Driving Growth
Racial and ethnic diversity is driving what growth there is: Hispanic, Asian, and multiracial groups account for most population gains, and their shares of both the total and youth population are rising. More people are also responding to surveys with a mix of races or ethnic groups.
Domestic and International migration have been playing a larger structural role: recent years show high immigration rates relative to emigration, helping offset low fertility and an older age structure. Net international migration has been a major growth factor in many parts of the US, especially in the Northeastern state. This, however, has already started changing. In 2024, 11.8% of all US residents moved to a different residence, down from 12.1% in 2023; yet only 2.1% of us moved to a different state in 2024, which is also down from 2.3% in 2023 (US Census one-year ACS estimates). In 2025, California lost population due to both domestic out-migration and lower net international migration.
Here in Nebraska, our two large metro areas—Omaha and Lincoln—have grown the most in absolute population. Yet while most metro counties have natural increase (more births than deaths), that is mostly offset by net domestic outmigration (more people leaving for other places in the US than moving in). Without international migration, even the big cities will be shrinking here. The pattern holds in “micropolitan” areas such as Columbus (Platte County) and Kearney (Buffalo County) in Nebraska, as well. (I’ll hold my political conspiracy theories for a more appropriate venue…)
Next month, in March, we’ll see how the first half of last year played out for population at the county level when the Census Bureau releases those estimates (for 1 July 2025).
Worldwide: Slower Growth and Approaching Peak
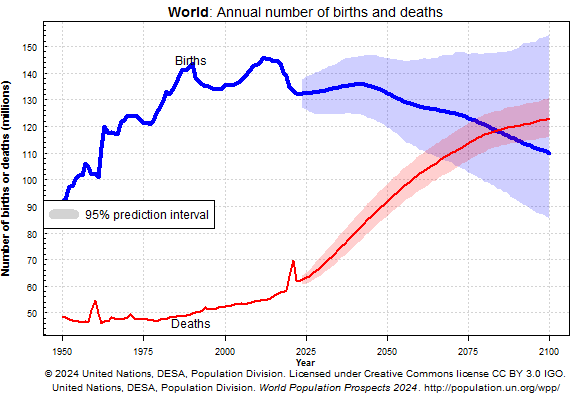
The world passed 8 billion people in the early 2020s, but growth is decelerating as fertility falls in most regions. UN projections now expect global population to peak around mid‑century at roughly 10–10.3 billion and then decline gradually by 2100, a major shift from older expectations of continued growth.
Here in North America, Canada’s population growth has recently been among the highest in the G7 (Group of Seven) nations of Canada, France, Germany, Italy, Japan, the United Kingdom, and the United States). Canada’s population passed about 41 million by late 2024, with most recent growth due to high levels of immigration. Ontario, Quebec, British Columbia, and Alberta together receive the bulk of new immigrants, but immigration has diversified, contributing significantly to growth in Atlantic Canada and the North. Alberta has gained from interprovincial migration.
In Europe, the UK and Ireland have seen moderate growth, as have Australia and New Zealand in the Pacific. Since 2020, almost all population growth in the UK has come from net migration; growth is strongest in London, the South East, and certain university and tech cities. Ireland’s fastest growth has also been around that nation’s capital of Dublin. Down under, big cities are also attracting more people although many regional and rural areas are also gaining residents, especially in exurban areas, on coasts, and places with strong amenities.
More countries are shrinking in absolute terms: in 2024, about 61 countries already had declining populations due to very low fertility and sometimes emigration, including China, Japan, and Russia. In Europe, Italy is losing population and Germany is close behind. Life expectancy continues to rise in most places, so even where population size stabilizes or falls, aging continues.
Very Low vs Still High Birth Rates
Life expectancy continues to rise in most places, so even where population size stabilizes or falls, aging continues. All G7 members have fertility below the “replacement” level of about 2.1 births per woman, with Japan, Italy, and Germany among the lowest globally. Immigration has kept Germany’s population from shrinking as fast as Italy’s, but both face shrinking youth cohorts and growing pension and health‑care burdens. East Asia is showing some of the lowest levels recorded: countries such as South Korea and others in the region have “ultra‑low” fertility, prompting concerns about rapid aging and shrinking workforces.
Many formerly high‑fertility countries—India, Bangladesh, much of Southeast Asia, parts of the Arab world, and Latin America—are transitioning toward low fertility and slower growth. West Africa stands out as a region where fertility remains high and population growth very rapid, even as neighboring North African countries fall below replacement.
Aging and Migration at Play Worldwide
Population aging is now a common feature of advanced and many emerging economies, driven by low fertility and rising life expectancy. Median ages are high and rising; Japan and Italy are at or near 50, with G7 countries projected to have a median age around 48.5 by 2100 versus about 41.9 globally. Across the OECD nations, the working‑age population (20–64) is projected to fall by about 8% by 2060, with more than a quarter of OECD countries seeing declines over 30%.
In Japan, Deaths now exceed births by close to a million per year, and the working‑age share has fallen to about 59%. Aging implies a higher old‑age dependency ratio (more retirees relative to workers), which raises fiscal and labor‑market questions for both rich and middle‑income countries. Again across the OECD nations, the old‑age dependency ratio (65+ relative to working‑age) rose from 19% in 1980 to 31% in 2023 and is expected to hit 52% by 2060, turning labor’s contribution to growth from positive to negative in almost all of the more wealthy economies.
Migration increasingly acts as a “mitigation” tool for aging societies: inflows of working‑age migrants can temporarily bolster labor forces and, to a degree, slow aging. In Canada, immigrants make up about 23% of the population, the highest share in over 150 years, and recent population growth has been among the fastest in the G7.
Some countries that once sent many migrants abroad are on track to become net receivers as their own fertility drops and economies grow, especially across parts of Asia and Latin America. In many of these regions, large youth and young‑adult cohorts still offer potential “demographic dividends,” but realizing this depends on job creation and skills; East Asia is moving rapidly into advanced aging similar to the G7.
Diverging Regional Futures
Many of the high‑income and many upper‑middle‑income countries face combinations of stagnant or shrinking populations, very low fertility, and advanced aging. Lower‑income regions, particularly parts of sub‑Saharan Africa, are entering or remaining in a phase of rapid growth, youthful age structures, and pressure on services and jobs. Over the coming decades, this divergence is expected to shift the geographic center of global population and, potentially, the geography of economic growth and migration flows.

The Rural-Urban Demographic Split
Rural and urban populations differ in size, age, diversity, and growth almost everywhere, but the direction of change is similar: more people in cities, aging and decline in many rural areas, and growing diversity in large urban centers.
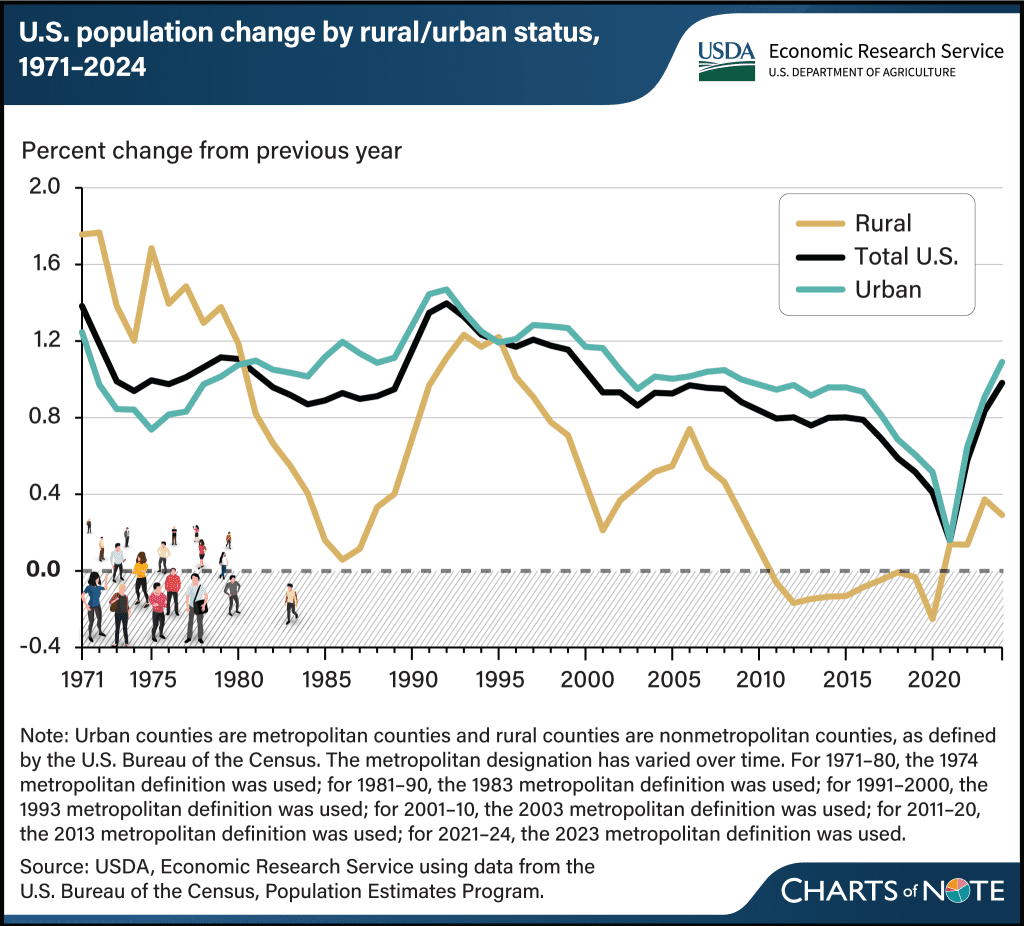
In the U.S., about 80% of people live in areas considered urban and about 20% in rural areas. Rural population growth since 2020 has come almost entirely from net in‑migration (people moving in), after net losses in 2010–2020. Here in Nebraska, rural counties who fail to attract international migrants almost universally have lost population overall. My own home county is an exception, although neighboring counties have taken more than their share of immigrants for their factory and slaughter house jobs.
The latest population estimates for 2024 report the greatest growth among counties under 50,000 residents in counties like Chambers (Greater Houston metro), Kendall (San Antonio metro), and Caldwell (Greater Austin metro) in Texas; Dawson County, Georgia (Atlanta); and McClain County, Oklahoma (Oklahoma City metro). Bonner County, Idaho, in the Sandpoint Micropolitan Area, is also at the top for absolute population growth since 2020.
At the same time, some small towns and rural counties have seen a post‑pandemic revival. Broadwater County, Montana, between the state capital of Helena and the new metro area of Bozeman-Gallatin County, has grown by 21% since 2020 to a whopping 8,302 residents. Custer County (located between the Sangre de Cristo Mountains and the Wet Mountains of Colorado) has grown by 17.5%; San Juan County and Silverton, Colorado, have grown by 16%. Like Bonner County, Idaho, they are all amenity-rich areas. Two‑thirds of recent US growth in the 25–44 population has been occurring in small metros and rural areas rather than big cities.
Around the World
Other nations such as the UK have seen population gains in rural ex-urban areas within extended commuting range of larger cities as people search for more affordable housing and small town lifestyles. They also have better train service than the US! In Canada, the rural population actually grew in the latest census period, with strongest results in remote places like Nunavut and Prince Edward Island.
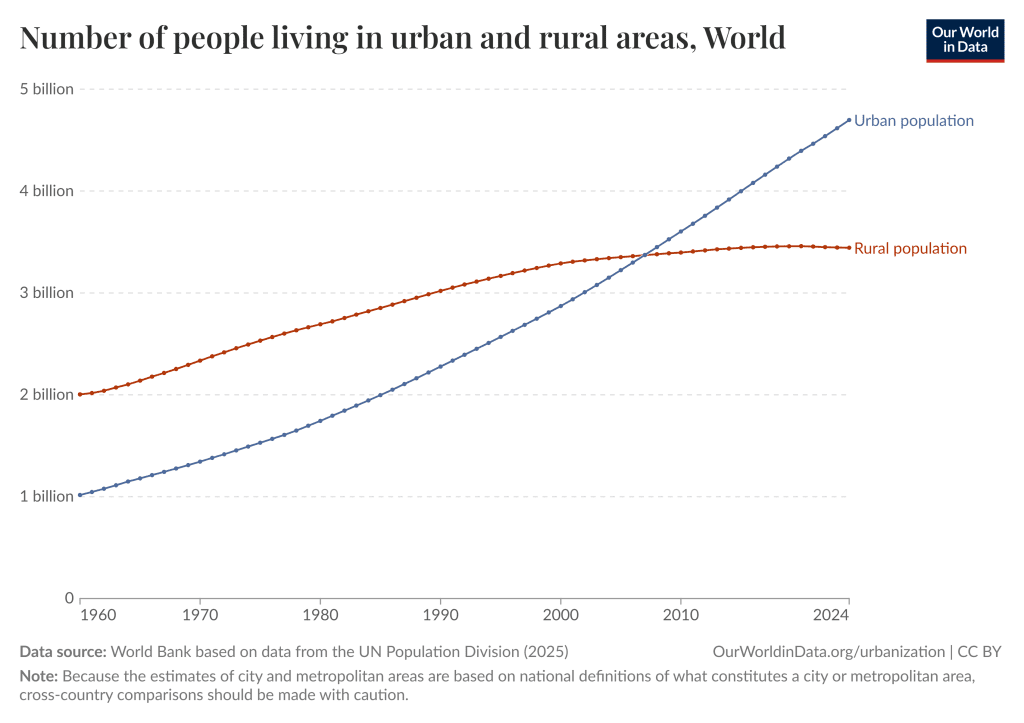
Globally, urbanization is advancing. In Organization for Economic Co-operation and Development (OECD) countries, city populations grew about 24% from 2000–2020, compared with only 6% in rural areas. Rural areas in the G7 are generally older, slower‑growing (or shrinking), and more vulnerable to service loss than cities, with Japan and Italy at the sharpest end of the trend and North American rural regions somewhat more mixed.
Low fertility plus decades of youth out‑migration mean many rural regions now have small child cohorts and very high shares of older adults. Negative net migration has pushed many rural areas worldwide into outright population decline; about 10% of the global rural population lives where out‑migration has turned growth into loss.
Critical service gaps in areas such as health care, broadband, and transportation make it even harder to retain rural residents. The UN projects about 68% of the world’s population will live in urban areas by 2050, while the absolute rural population peaks and then declines.
An Aging Population
Rural America is aging faster than urban America: by 2022, 20% of rural residents were 65+ (vs. 16% urban), and the working‑age share (25–64) in rural areas fell from 50.6% in 2000 to 49.3% in 2022. The number of rural residents aged 15–64 fell from over 30 million in 2010 to about 28 million in 2023, while rural 65+ grew from 7.4 to 9.7 million, forcing communities to rely on a smaller labor force to support more older people and children.
Across G7 and OECD member states, rural areas are generally aging and shrinking faster than cities, feeling the demographic squeeze earlier and harder. In many European and East Asian countries, rural regions face both very low fertility and sustained out‑migration of young adults, leading to “left‑behind” older populations. Japan’s countryside is the clearest example: some villages now have two‑thirds of residents age 65+, with populations falling from thousands in the 1950s to only a few hundred today, and widespread abandoned homes (akiya). Elderly dependency ratios are several points higher in remote rural areas than in metropolitan regions across much of the Western world.
Cities in richer nations are also aging, yet attract more young adults and migrants who typically can support the aging population. For example, across 29 OECD countries the share of residents 65+ in metropolitan and surrounding areas is projected to rise from about 21% to 28% between 2020 and 2040, even as rural regions start from an older baseline. Fewer working age adults mean tighter labor supplies, just as demand for elder-care and medical services rises.
Urbanization and Land Consumption
In the U.S., large urban areas are much more racially and ethnically diverse: people of color now make up over half the population of major urban areas, while about three‑quarters of rural residents are White. Urban counties have grown at or above the national rate since 2000, while many rural counties have lost population; immigration and internal migration toward cities and suburban areas are big drivers of urban growth.
Globally, roughly half of the rural population lives in countries where negative net migration slows rural growth, and about one‑fifth lives where it accelerates rural decline. Rural populations are still growing in parts of sub‑Saharan Africa, but they are flat or falling in Europe, North America, Australia, and New Zealand. Yet rural built‑up land has roughly doubled since 1975, reflecting more land consumption per person.
Urbanization worldwide is expected to add billions of city dwellers by 2050, making most future population growth effectively an urban phenomenon and heightening the importance of planning for sustainable cities and rural–urban linkages. This divergence is pushing national policy debates about how much to protect and fund services in shrinking areas versus concentrating investment in growing urban corridors and regional hubs.
We also need to remember rural areas are not uniform. Across North America, for example, some regions—amenity‑rich areas, exurban counties, tribal lands, energy or tourism hubs—are growing, some rapidly, while others see their population and economies stagnate or contract. Internationally, rural regions close to cities differ sharply from remote rural areas; those near cities tend to have more growth, higher density, and better access to services than remote, sparsely populated regions. As aging accelerates worldwide, rural areas will need to adapt infrastructure, health care, and labor markets to serve a higher share of older residents, with fewer working-age adults and tighter local tax base.

Population Trends in Planning & Public Policy
Demographic trends are reshaping what cities and regions need to plan for: fewer children and more older adults, continued urbanization, and large migrant flows are changing demand for housing, transport, services, and finances. Policy debates in the U.S., G7, and OECD are tending to focus on “rural resilience”: combining targeted migration, better training and wages for key occupations, and redesigned services (telehealth, mobile teams) to cope with structurally smaller and older rural workforces.
Aging Populations and “Age-Friendly” Places
As populations age, planners must retrofit housing and neighborhoods so more people can safely “age in place” (step‑free access, elevators, proximity to services, safer streets). Older residents need different types of homes than young families. Aging also puts pressure on education, health, and social infrastructure, pushing cities to expand community health centers, home‑care services, and senior‑oriented public spaces even while schools and youth activities face contracting support.
In response, some national leaders are taking action. Policies in more well-off nations seem to be converging on a mix of “age‑friendly” services, place‑based revitalization, and broader rural resilience strategies, but the balance differs sharply between Japan and Southern Europe on one hand and North America and northern Europe on the other.
Common rural-aging policy themes include:
- Investing in services for older residents: mobile or digital healthcare, telemedicine, home‑care, and adapted transport networks to reduce isolation in sparsely populated areas.
- Supporting “age‑friendly” rural environments: housing retrofits, barrier‑free public spaces, and social inclusion projects that keep older people active and embedded in community life.
- Shifting to place‑based rural policy: the OECD now recommends tailored, multi‑sector strategies—rather than one‑size‑fits‑all subsidies—to respond to differing rural aging and depopulation patterns.
Health care is already a major concern around the world. The question is will advances in policy and funding be able to keep up with advances in technology and public expectations?
Many communities are embracing the opportunity of “the silver economy.” Many of the Baby Boomers now in retirement have money to spend. According to the European Commission, those over 65 in the EU have a combined spending capacity of EUR 3,000 billion. OECD reports also note, “we shouldn’t overlook the entrepreneurship potential of older residents. While older people may be less likely to take on entrepreneurial risk, research finds that older entrepreneurs are more likely to be successful, not least because they have more developed networks, more experience and, in many cases higher skills and more financial resources. They can also lend their skills and experience to younger entrepreneurs as mentors.”
While transit in urban areas has been focused on commuters and peak hour service, rural areas have long-served senior citizens and others who need point-to-point service like dial-a-ride. Transportation planning will need to account for the need for more frequent, accessible local mobility—shorter trips, benches, lighting, and safe crossings for slower walkers.
Urbanization, Growth, and “Shrinking Cities”
Most future population growth will happen in cities, especially in Africa and Asia. Government at all levels will be pressured to manage rapid urban expansion, sprawl, informal settlements, and basic service provision. Other cities are shrinking or barely growing, particularly in parts of Europe, East Asia, and older U.S. metros, which creates vacancies, underused infrastructure, and fiscal strain.
Planning responses range from compact‑city strategies (densifying cores, re‑using vacant land as green space) to “planned shrinkage” approaches that right‑size infrastructure over time. The latter is potentially highly fraught, as we have seen in rural America with the old, tired proposals to empty out small towns across the Great Plains. Initiatives such as the EU “Smart Villages” and other policy funds back digital infrastructure, innovative service delivery, and active‑aging initiatives in rural regions across Italy, France, Germany, and others.
Japan, home of some of the world’s largest cities, is actively managing extreme rural shrinkage. The government there has spent decades using an “anti‑depopulation law” and massive infrastructure subsidies (roads, communications) to support shrinking municipalities; about 40% of a roughly 1‑trillion‑USD program went to such investments between 1970 and 2018. Current strategies emphasize “regional revitalization”: consolidating municipalities, redesigning local economies (including circular‑economy projects), and repurposing abandoned housing while adapting services for a very old population.
International and internal migration can keep some cities, and even small towns, growing when births are low. Public policy has to address language access, schooling for children of migrants, legal status and labor protections, and anti‑segregation measures in housing and education.
Housing, Land Use, and Neighborhood Change
In conjunction with changes from aging, household sizes are falling, increasing demand for smaller, often rental, units. This typically alters the balance of demand between single‑family homes and multifamily housing.
In fast‑growing cities, demographic pressure intensifies housing shortages and affordability problems, increasing pressure for zoning reform, more social or subsidized housing, and better links between housing and transit. In cities with stagnant or aging populations, policy questions focus more on vacancy reuse, maintaining services in low‑demand neighborhoods, and keeping a viable tax base.
We’ll be discussing housing more later in this series.
Fiscal and governance impacts
Demographic trends influence policy choices for recommended goals and action items throughout a community plan, from housing and economic development to public facilities, land use, and transportation. A community needs different types of housing, different types of jobs, different parks and schools and health care and transit.
Aging and slower growth also change the local tax mix: fewer workers and more retirees can weaken income and payroll tax bases while raising spending on care and accessibility. Urban policies increasingly integrate demographic forecasting into long‑term plans and “national urban policy” frameworks, aligning transport, housing, climate, and social policy with expected population change.
Because demographic shifts are uneven across neighborhoods and communities, city and county governments are using more granular data to target investments to areas with more rapid child growth/decline, concentrated aging, or intense migrant inflows or outflows.
Putting People in the Plan
Planning may focus on places, but the people make the place. It is important to have a good picture of a community’s population—the current demography as well as the long-term trends from past to future.
Data collection includes quantitative and qualitative information, both existing and new. There are 1,958 non-metropolitan counties in the United States (out of 3,144 total), as defined most recently by the US Office of Management and Budget in 2023. This includes 658 “micropolitan” counties. These non-metro counties are home to about 46.2 million people covering ¾ of the US land mass. The availability, error rates, and non-disclosure of data vary considerably between metropolitan and non-metropolitan “rural” counties. Planners and decision-makers should understand the constraints of data and carefully choose the best available sources.
Given the data available or which can be gathered, baseline analysis typically starts with existing resources and networks to inform data collection and analysis. The baseline also provides points of reference for future evaluation of goals and objectives.
Statistics
Quantitative “hard data” statistics are available in the United States from a variety of public and private data sources, including the US Census Bureau, US Bureau of Economic Analysis (BEA), US Bureau of Labor Statistics (BLS), and others.
Currently, the Census Bureau’s American Community Survey (ACS) is typically the most common source for county- and local-level demographic data across a variety of topics. Covering more than 40 topics—including education, employment, income, housing, and transportation—the ACS provides crucial insights into the changing needs and conditions of communities. While the decennial census gives a rich historical record, challenges in 2020 due to the COVID pandemic resulted in significant nonresponse rates. Annual ACS results are released for larger jurisdictions; however, only five-year rolling average ACS results are released for most small towns and rural counties. Due to the Fall federal government shutdown, the latest 5-year ACS data was just released at the end of January 2026.
Most employment and income data is only available at the county level. While the ACS provides socioeconomic data for municipalities as well as counties, BEA and BLS data typically have smaller margins of error when available. The BLS Quarterly Census of Employment and Wages (QCEW) is the most comprehensive source of county-level employment data, covering more than 95% of US jobs. The BLS Local Area Unemployment Statistics (LAUS) produces monthly and annual employment, unemployment, and labor force data. The BEA Personal Income by County data set is a more comprehensive annual estimate of personal income; however, BEA has recently discontinued many data reports covering rural counties.
The US Census Bureau County Business Patterns (CBP) provides annual data on establishments with paid employees, including employment during the week of March 12, first quarter payroll, and annual payroll by industry and employment size. CBP data primarily covers private sector establishments and excludes most government employees, which can be a large employment sector in rural areas.
USDA Economic Research Service (ERS) also provides County-Level Data Sets which compile interesting socioeconomic indicators including poverty rates, population change, unemployment rates, and median household income. ERS provides downloadable county-level data with Rural-Urban Continuum Codes and Urban Influence Codes.
State, regional, county, and local units of government can also provide useful data, such as school enrollment, public safety staffing, well logs, or building permits. The plan may present the most recent data and compare the plan area with other benchmarks. As well, looking at changes over time helps highlight trends and plan for future needs of the community.
Statistical Sources in Other English-speaking Countries
Given ongoing drama in Washington, DC, our friends and neighbors across the English-speaking world should be glad they have their own impartial sources of statistics. Some of these include:
- Canada: Statistics Canada (StatCan). The national statistical office; runs census and hundreds of surveys on population, economy, society, environment.
- UK: Office for National Statistics (ONS). UK’s largest producer of official statistics; economy, population, society; runs census in England & Wales (with some functions devolved to Scotland, Wales, and Northern Ireland).
- Ireland: Central Statistics Office (CSO). Collects stats on economic, social and general conditions; runs the census in the Republic of Ireland.
- Australia: Australian Bureau of Statistics (ABS). National statistical agency; census, and wide‑ranging economic, demographic, social and environmental data.
- New Zealand: Stats NZ (Statistics New Zealand). Public service department for economic, population and social statistics; runs censuses and surveys.
The primary official source for EU demographic statistics is Eurostat, the statistical office of the European Union. Their website offers human-translated pages in English, Deutsch, and Français, and a variety of machine-translated languages.
Note
I like to do family history—it gives me a tangible connection to places all over the world, where my ancestors came from and where my (often distant) cousins emigrated. Most of these agencies provide historical census reports and archived publications—nothing like a good primary source to cheer me up on a dreary winter day.
Feel free to share your favorite sources for international demographic and economic statistics. More on this when we get to economic development later this year.
Soft Data
Soft data collection for community assessment gathers qualitative insights and contextual information through methods like interviews, focus groups, public meetings, and surveys, which we discussed in January.
- Conducting individual interviews and guided group discussions allows collection of detailed stories, perceptions, and experiences from community members and key stakeholders.
- Public forums and community meetings serve as platforms for residents to voice their concerns and ideas in a group setting.
- Surveys with open-ended questions yield narrative responses, ideas, and perceived needs of the community.
In addition, the planning team should not neglect immersive direct observation—there is no substitution for getting away from your computer and spending time in the community.
Data to Information
Analysis and interpretation turn data into information. Demography can be simple or as complicated as a PhD dissertation. Effective communication in community planning, though, may be as simple as charting population, housing, or employment over time; it may mean taking that information and projecting growth based on past trends. These methods may be simple or complex—pick the method appropriate for the planning team, disclose methodology, and present conclusions in a straight-forward manner. Data for data’s sake is not worth much. Data which informs decision-making is priceless.
Ample use of charts and graphs, including infographics, sketches, and photographs, help communicate ideas as well as break up heavy, dense blocks of text. Most modern plans utilize geographic information systems (GIS) mapping to study and inform decision-making throughout the planning process.
Analyzing results is an important part of the assessment process to develop actionable reports and recommendations. It is essential that evaluation criteria and baselines are aligned with available resources and specific local needs.
Case Studies
Burwell, Nebraska
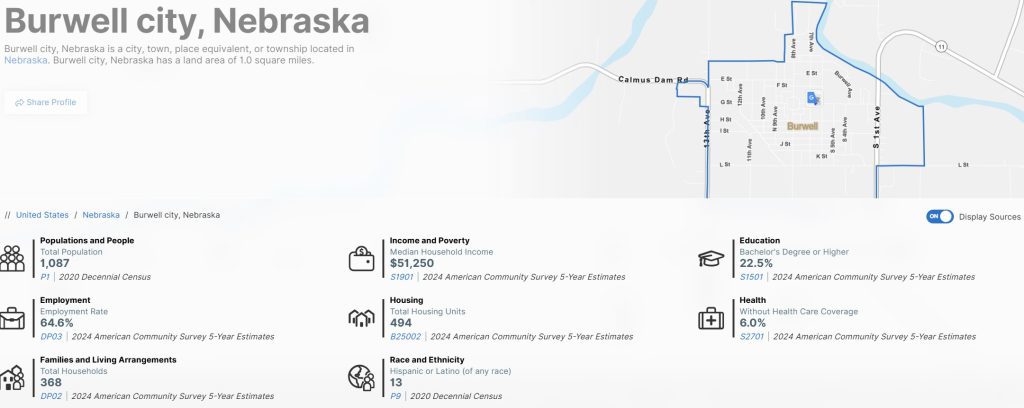
Marvin Planning Consultants (MPC) worked with the small city of Burwell, Nebraska(population 1,210), on their Comprehensive Plan update, Zoning Regulations review, Strategic Plan, and first-ever Capital Improvements Plan (CIP), with partners at MSA Professional Services and a free-lance consultant. In 2024, the City adopted the plans documenting the Planning Commission’s public process, and in 2025 the process was recognized with awards from the Nebraska Chapter of the American Planning Association (APA) and the APA Small Town & Rural Planning Division (STaR). The key was strong local leadership and partnerships for community engagement.
We start off these plans with an introduction to the community. The second chapter typically documents the community engagement process (sometimes more detailed results are moved back into an appendix).
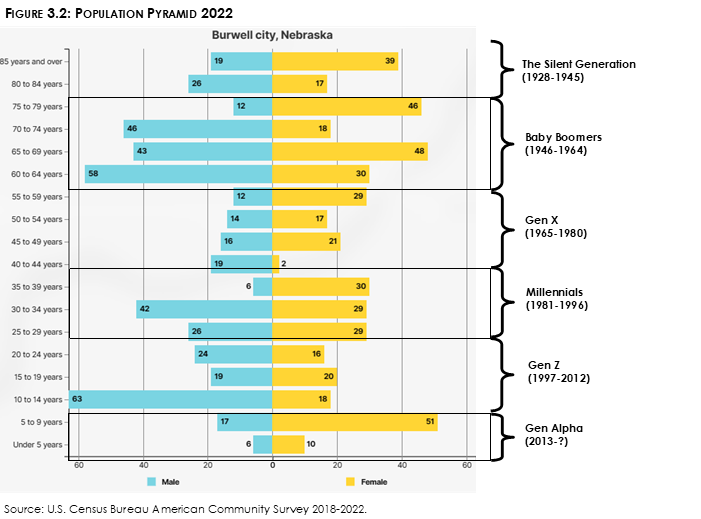
Chapter Three: Population starts off with a general discussion of population trends and projections, and caveats about the accuracy of Census data in small towns (often large margins of error, but the best we’ve got). The long-term decennial census complete counts framed total population, but the ACS 2018-2022 five-year series was the most recent data set available for more detailed numbers at that time.
We looked at demographic statistics such as:
- Population Pyramid
- Median Age (city vs state)
- Dependency Ratios (share of youth and 65+ compared to working age)
- Ethnicity
- Educational Attainment (city vs state)
- Veteran status
We also looked at components of population change, including a more detailed look at change in different age cohorts over the previous 10-year period, and county-level components of population change (natural change compared to net migration).
For most of our clients, we take a fairly straight-line approach to population projections. I know there are entire books out there, because I have to look up statistical analysis methods every time I do these to make sure I’m getting the math right. Basically, we take the State Data Center projections as one trend line. We then extrapolate decade-by-decade trends to come up with a cold-medium-hot set of estimates. Prepare for the best case and the worst case, and you should do ok with the average.
Demographic trends influenced goals and action items through out the comprehensive plan, as well as the strategic plan, CIP, and zoning ordinance. For example, housing action items included encouraging private development of “Missing Middle” housing in the community, to provide a place for families at all points of their life cycles. Economic development goals and actions included support for K-12 and community college training in the community, which are also included in the facilities chapter.
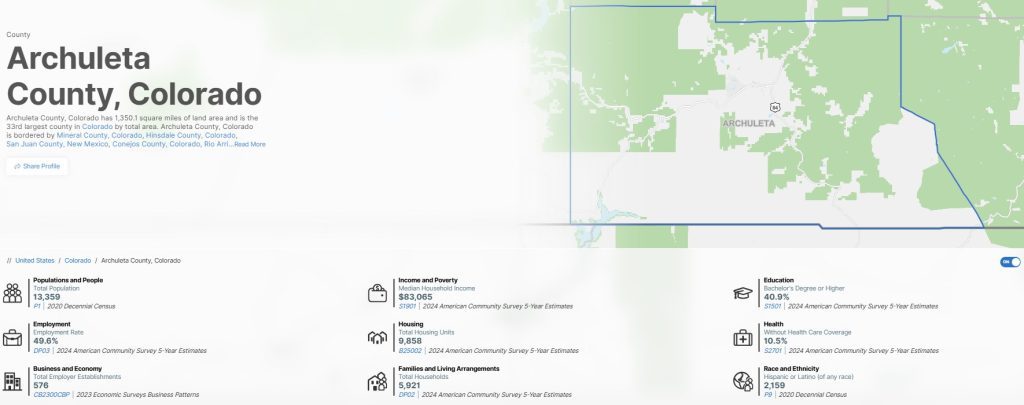
Archuleta County, Colorado
When I worked in Pagosa Springs, Colorado, I was able to work with the Archuleta County Planning Commission to update the Archuleta County Community Plan, which had been adopted by the Planning Commission in 2001, when the County first instituted zoning. The update was approved in 2017 (about due for an update now!). We had a great Planning Commission then, and did our best to involvement the community in the review.
The population of Archuleta County at that time was about 12,845—the current estimate as of 2024 is over 14,000 residents. Neither number accounts for the numerous visitors and part-time residents.
We structured this plan differently, in four parts with appendices for the more detailed demographic and economic statistics so as not to interupt the flow of the narrative. Up in the mountains, the natural environment was a major concern and led the comprehensive plan. The built enviornment, including economic development and housing, took up the next part, followed by land use, including growth management and plan implementation.
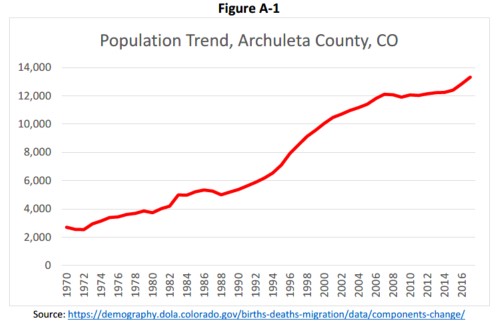
Population set the stage for both economic development and housing. The county only started to attract a large number of residents in the 1980s, booming in the 1990s, then saw growth slow from 2000 to 2010. The boom and bust cycle typical of timber industry was a familiar preview for the emerging retirment and tourist-oriented economy of the 21st century.
We relied on the ACS 5-year average data, again the best estimates available for a rural county. The Colorado State Demographer also provides excellent estimates and projections, among the easiest to access of any state I’ve worked in (although Nebraska’s data center is top notch). As mentioned, I included charts and graphs with a more detailed narrative in an appendix. This included:
- Annual population estimates from the Colorado Demography Office
- Description of growth trends comparing the county to Colorado and the nation at large—at the time, Archuleta County was the 14th fastest growing county in the US.
- Age profile analysis from housing studies by Economic & Planning Systems (EPS).
- Population projections from the State Demography Office, EPS, and RPI Consulting (developed during our Growing Water Smart collaboration with the Sonoran Insitute and Lincoln Institute of Land Policy.
I also pulled a lot of data from Headwater Economics’ Economic Profile System rather than accessing the data directly from the federal websites, which were not nearly as accessible 10 years ago as the are today. I highly recommend them for data aggregation and they don’t charge for the service. From their website:
The Economic Profile System is a free, easy-to-use tool that provides access to 17 socioeconomic reports. Customized reports are available for U.S. communities, counties, and states and can be downloaded as Excel or PDF files.

Conclusion
Demography may not be destiny in the sense of a fixed script, but it does set the stage and narrow the range of believable plot twists. A country—or a county—that is older, slower‑growing, and more dependent on migration simply has a different set of choices than one adding children and workers by the thousands each year.
The point of watching these numbers, whether at the global, G7, or Burwell, Nebraska, scale, is not to predict the future with false precision. It is to be honest about the trends already baked into the age structure and migration patterns, and then write local plans that respond to those realities instead of wishful thinking.
For planners and community leaders, that means treating demographic analysis as more than a perfunctory chapter at the front of a comprehensive plan. Population pyramids, dependency ratios, and migration maps should show up again in the housing strategies, the economic development goals, even the capital improvements schedule.
If we know we are getting older, we plan for aging in place. If we know we rely on new neighbors from somewhere else, we plan to welcome them. Demography may not decide everything—but ignoring it is a decision too, and rarely a good one.

Read More
Books
These are ideas on the topic of demography and growth around the world. I have not read them, but I have checked my local library.
Empty Planet: The Shock of Global Population Decline by Bricker and Ibbitson (Crown, 2019)
Darrell Bricker and John Ibbitson argue that urbanization and female empowerment are driving fertility rates down faster than UN models predict. They suggest we are heading toward a “bust” rather than a “bomb,” which will reshape geopolitical power.
8 Billion and Counting: How Sex, Death, and Migration Shape Our World by Jennifer D. Sciubba (W.W. Norton & Company, 2022)
Political demographer Jennifer D. Sciubba offers a broader look at how differential growth rates (aging rich nations vs. young poor nations) define national security and economics.
The Great Demographic Reversal: Ageing Societies, Waning Inequality, and an Inflation Revival by Goodhart and Pradhan (Palgrave Macmilan, 2020)
Authors Charles Goodhart and Manoj Pradhan argue that the deflationary era of the last 30 years is ending. As populations age and the labor supply shrinks, the world will likely face higher inflation and higher worker wages—a reversal of recent economic history.
Reports
United Nations Demographic Yearbooks – Global population, fertility, mortality, migration, and urbanization statistics
World Population Prospects 2024 (PDF) – UN Population Division. Current global baseline for fertility, mortality, and migration projections.
Confronting the consequences of a new demographic reality (McKinsey Global Institute report). Good synthesis of how falling fertility and aging change growth, inequality, and public finance. Link here.
More from JCShepard.com
2026: Bring Your Plans to Life – Monthly Themes Preview
- Reviving Rural America: Why Heritage Tourism Is a Game-Changer Now (September 2025)
- How Small Towns Succeed: A Proven Playbook for Rural Action (November 2025)
- The Rural Comeback: How Small Town Innovation Sparks Growth (August 2025)
- How Small Towns Can Build a Strong Outdoor Economy Without Selling Out (June 2025)
Check out The 12 Planning & Sustainability Books You Need in 2026 and browse through the Small Town & Rural Community guides on our Resources page.
(As an Amazon Associate, we may earn commissions from qualifying purchases. Check your local library or bookshop, too.)
.